Journal of Research in Dental
and Maxillofacial Sciences
Volume 11, Issue 1 (3-2026)
J Res Dent Maxillofac Sci 2026, 11(1): 45-56 |
Back to browse issues page

Ethics code: IR.TUMS.DENTISTRY.REC.1399.254
Download citation:
BibTeX | RIS | EndNote | Medlars | ProCite | Reference Manager | RefWorks
Send citation to:


BibTeX | RIS | EndNote | Medlars | ProCite | Reference Manager | RefWorks
Send citation to:
Milani S, Shahrabi M, Hosseini Z, Amini Harandi F, Baniebrahimi G. Cariogram Profile of Iranian Children in the Primary and Mixed Dentition Periods. J Res Dent Maxillofac Sci 2026; 11 (1) :45-56
URL: http://jrdms.dentaliau.ac.ir/article-1-1171-en.html
URL: http://jrdms.dentaliau.ac.ir/article-1-1171-en.html
Shabnam Milani1 
 , Mehdi Shahrabi2 , Zahra Hosseini3 , Fatemeh Amini Harandi4 , Ghazaleh Baniebrahimi *5
, Mehdi Shahrabi2 , Zahra Hosseini3 , Fatemeh Amini Harandi4 , Ghazaleh Baniebrahimi *5
1- Department of Pediatric Dentistry, Faculty of Dentistry, University of British Columbia, Vancouver, Canada
2- Department of Pediatric Dentistry, School of Dentistry, Tehran University of Medical Sciences, Tehran, Iran.
3- Department of Pediatric Dentistry, School of Dentistry, Tehran University of Medical Sciences, Tehran, Iran. & Dental Research Center, Dentistry Research Institute, Tehran University of Medical Sciences, Tehran, Iran
4- Dentist in Private Practice, Tehran, Iran
5- Department of Pediatric Dentistry, School of Dentistry, Tehran University of Medical Sciences, Tehran, Iran ,ghazalebaniebrahimi@gmail.com
2- Department of Pediatric Dentistry, School of Dentistry, Tehran University of Medical Sciences, Tehran, Iran.
3- Department of Pediatric Dentistry, School of Dentistry, Tehran University of Medical Sciences, Tehran, Iran. & Dental Research Center, Dentistry Research Institute, Tehran University of Medical Sciences, Tehran, Iran
4- Dentist in Private Practice, Tehran, Iran
5- Department of Pediatric Dentistry, School of Dentistry, Tehran University of Medical Sciences, Tehran, Iran ,
Full-Text [PDF 394 kb]
(30 Downloads)
| Abstract (HTML) (47 Views)
Introduction
Dental caries is a chronic, complex, and multifactorial disease [1]. Despite a general decline in caries rate among children and adolescents worldwide, its incidence remains variable across different communities [2]. The concept of caries control has changed in the recent years, and a greater emphasis has been placed on the multifactorial nature of caries and the role of biofilm [3]. Primary tooth caries is among the most common diseases worldwide, with hundreds of millions of children affected according to recent global burden of disease estimates. The pattern of dental caries in children depends on the timing of tooth eruption and unhealthy dietary habits. Therefore, age is an important parameter that affects dental caries prevalence in children [4].
An increase in caries prevalence has been reported by the shift from primary dentition to permanent dentition [5]. The first 5-6 years after the eruption of permanent first molars are particularly important. Caries prevalence in the primary dentition period can predict the incidence of caries in permanent first molars [6]. A correlation has been reported between caries experience in the primary and permanent dentition periods. Caries experience in 3 or more primary teeth at the age of 5 years is the best predictor of caries experience in permanent first molars at the age of 7 years [7]. The oral cavity is in a transient stage from the onset of eruption of primary teeth (6-8 months old) until the eruption of permanent second molars (around 12 years of age) [8]. The caries status of newly erupted permanent teeth is correlated with the caries status of primary teeth [9]. Considering the variations in the risk of caries in different age groups, caries risk may be minimized by its estimation in different dentition periods and identification and alteration of influential factors in this regard [10]. Several tools have been proposed for caries risk assessment including the Caries Management by Risk Assessment and Cariogram. The validity of these models has been previously investigated and confirmed in the literature [11-14]. A computerized caries risk assessment model was introduced by Bratthall [15] in 1996 known as the Cariogram to further simplify this process. Cariogram is a software program that assesses the interactive effects of 10 different caries risk factors, including the salivary secretion rate, buffering capacity of the saliva, caries experience, related diseases, diet, diet frequency, fluoride program, clinical judgment, presence of Streptococcus mutans (S. mutans) in the saliva, and plaque quantity. The program calculates and reports the risk of development of new carious lesions in near future, and the overall caries risk of the individual [16]. This program performs its assessments according to 10 pathological and protective factors along with a professional clinical judgment; since some of these factors have a greater correlation with caries development, they are weighted differently [17]. Cariogram is well capable of determination of caries risk, such that it can calculate the caries risk by scoring of only 7 out of 10 factors. Therefore, the performance of smaller models of Cariogram with inclusion of a lower number of factors should also be investigated [15–17].
Despite the wide application of the Cariogram, gaps remain in the literature. Few studies have directly compared caries risk profiles between primary and mixed dentition, and data from Middle Eastern populations are scarce. Simplified Cariogram models omitting microbiological testing have been investigated only in limited pediatric cohorts, and most available studies are cross-sectional, lacking longitudinal validation. These gaps highlight the need for further research in diverse populations. This study aimed to assess and compare the Cariogram profile of Iranian children in primary (5-6 years) and mixed (11-12 years) dentition periods. The null hypothesis of the study was that the Cariogram profile of Iranian children in the primary and mixed dentition periods would not be significantly different.
Materials and Methods
The study protocol was approved by the ethics committee of the university (IR.TUMS. DENTISTRY.REC.1399.254). This cross-sectional study was conducted on 100 children in the primary dentition period (between 5-6 years) and 100 children in the mixed dentition period (11-12 years). The children were selected among those presenting to the Department of Pediatric Dentistry of School of Dentistry, Tehran University of Medical Sciences in 2020-2021 who were selected by convenience sampling.
Sample size calculation:
The required sample size was calculated using standard formulas for quantitative and qualitative variables.
For quantitative outcomes:
n = ((Z_(1-α/2) x standard deviation) / d)^2
with α = 0.05 and d ≤ 0.3 x standard deviation
For proportions:
n = (Z_(1-α/2)^2 x p x (1 - p)) / d^2
with α = 0.05 and d ≤ 0.3 x standard deviation
Based on these calculations and previous studies on caries prevalence [18-26], the minimum required sample size was approximately 100 participants per group. Therefore, a total of 200 children (100 in the primary dentition group and 100 in the mixed dentition group) were included in this study.
Eligibility criteria:
The inclusion criteria were age, parental consent, optimal cooperation of children, and no food or drink intake or tooth brushing for a minimum of 1 hour prior to clinical dental examination. Cooperation was assessed using the Frankl Behavior Rating Scale; children with ratings of 3 (positive) or 4 (definitely positive) were included. The exclusion criterion was poor cooperation, defined as a Frankl rating of 1 (definitely negative) or 2 (negative).
Data collection:
All assessments in this study were conducted in accordance with the official Cariogram guidelines [27]. After obtaining written informed consent from the parents, an interviewer conducted a face-to-face parental interview using a checklist to ask questions about the child’s diet, fluoride program, and presence or absence of underlying systemic conditions. Data collected during the interview included the child’s dietary habits (specifically the consumption of sugary foods and beverages and the frequency of meals and snacks), and oral hygiene practices such as toothbrushing frequency, use of fluoridated toothpaste, and fluoride supplementation. Information on general health status, allergies, and medication use, along with demographic factors including gender, family socioeconomic status, and parental educational level, were also recorded. Following the interview, stimulated saliva samples were collected over a 5-minute period to measure the salivary flow rate and assess the buffering capacity of the saliva. Oral hygiene was evaluated for each child under adequate lighting using a dental mirror and an explorer. Based on the Oral Hygiene Index-Simplified (OHI-S) score, children were categorized into four groups of very good, good, poor, and very poor oral hygiene [28]. Subsequently, the decayed, missing, and filled teeth indices for primary (dmft) and permanent (DMFT) teeth were calculated according to the World Health Organization criteria [29]. These data were entered into the Cariogram model to estimate and report each child’s risk of developing new caries.
The factors evaluated in the Cariogram included caries experience, related diseases, diet contents, diet frequency, plaque quantity, salivary secretion rate, saliva buffering capacity, fluoride program, and clinical judgment, that were measured according to the instructions provided in the Cariogram guide [27]. Based on their calculated caries risk, children were classified into 5 categories: very low (0–20%), low (21–40%), moderate (41–60%), high (61–80%), and very high (81–100%) risk.
Salivary secretion rate: Salivary testing was conducted at the beginning of the treatment session, prior to the administration of any anesthetic agent or other clinical procedures. To ensure reliable results, the child was required to be calm. Stimulated saliva secretion was assessed in accordance with the Cariogram protocol. Each child was asked to chew mastic gum (Trident, Mondelez International, USA) for 5 minutes and expectorate into 15-mL Falcon tubes (Falcon, Corning Inc., USA). The collected saliva was then quantified and scored. All samples were obtained before noon to minimize diurnal variation. Salivary flow rates were categorized according to the Cariogram protocol [27]:
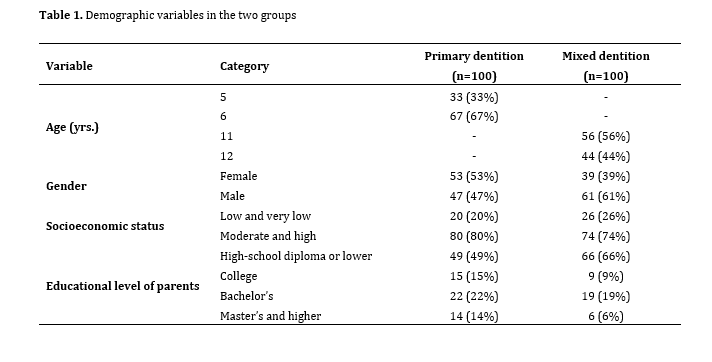
Table 1. Demographic variables in the two groups
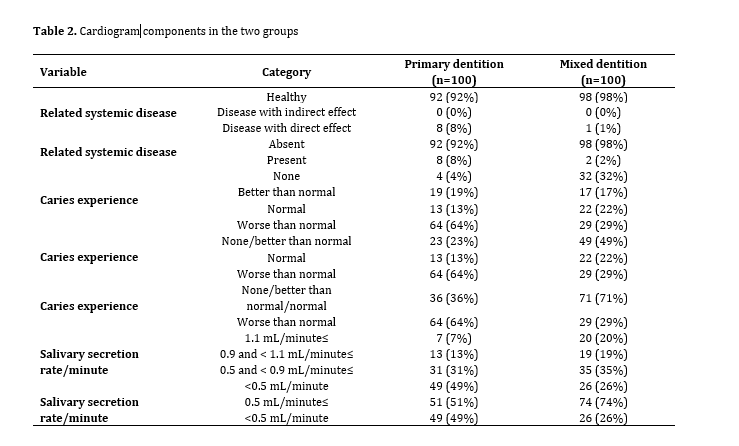
Table 2. Cariogram components in the two groups
In the mixed dentition group, 98% of the participants reported no systemic disease. A normal or better-than-normal caries experience was observed in 71% of the group. Salivary secretion rates of ≥0.5 mL/min were present in 74% of the children, and 99% exhibited a salivary pH of 6. OHI-S score greater than 0.1 was found in 96% of the participants. Regarding fluoride exposure, 71% either used only fluoridated toothpaste or did not use any fluoride product. In terms of carbohydrate consumption, 89% reported intake limited to main meals or fewer than three times between meals over a 24-hour period. Additionally, 74% had a meal frequency of 5 times or fewer per 24 hours. In 57% of the cases, clinical judgment was similar to or less favorable than the Cariogram prediction. Caries risk was classified as moderate in 32% of children, high in 27%, and very high in 22%.
There was a statistically significant difference in overall caries risk between children in the primary and mixed dentition periods, after adjusting for gender, socioeconomic status, and parental educational level. The mean caries risk was significantly higher in the primary dentition group compared to the mixed dentition group (74.92% vs. 56.60%, P<0.001).
In addition, the key components of the Cariogram model susceptibility (P<0.001), circumstances (P<0.001), and diet (P<0.001) were significantly higher in the primary dentition group.
Several significant differences were observed between the primary and mixed dentition groups. The odds of having a salivary secretion rate ≥ 0.5 mL/min were 2.61 times higher in the mixed dentition group compared to the primary dentition group (OR=2.61; 95% CI: 1.42–4.80; P=0.002). The odds of using both fluoridated toothpaste and fluoride mouthwash—regularly or occasionally versus using fluoridated toothpaste alone or no fluoride were also higher in the mixed dentition group (OR=2.41; 95% CI: 1.40–17.96; P=0.02).
Children in the mixed dentition group were more likely to have a balanced diet (score < 3), with odds of 3.14 times higher than those in the primary dentition group (OR=3.14; 95% CI: 1.60–41.99; P=0.01). Additionally, the odds of having a meal frequency of 5 times per day or fewer were 2.53 times higher in this group (OR=2.53; 95% CI: 1.35–4.76; P=0.004).
Caries experience also differed significantly between groups, with the odds of worse-than-normal experience being higher in the primary dentition group (OR=5.17; 95% CI: 2.74–9.74; P<0.001). Clinical judgment scores were more favorable in the mixed dentition group (OR=2.19; 95% CI: 1.20–4.01; P=0.01). No significant differences were found between the groups in terms of systemic disease (P=0.09) or plaque quantity (P=0.67).
Discussion
This study assessed and compared the Cariogram profiles of Iranian children in the primary (5–6 years) and mixed (11–12 years) dentition periods. Nine out of ten Cariogram factors were evaluated, with the Streptococcus mutans count excluded due to its high cost and limited feasibility in routine clinical settings. This limitation reflects the realities of everyday dental practice, where microbial testing is not commonly performed. Notably, previous studies that omitted microbial tests found that their exclusion did not significantly alter Cariogram results [3, 31-33]. The mean caries risk was significantly higher in children in the primary dentition period compared to those in the mixed dentition period (74.92% vs. 56.60%). In the primary dentition group, 43% of children had a high, and 41% had a very high risk of caries; whereas, these figures were 27% and 22%, respectively, in the mixed dentition group. Significant differences were observed between the two groups in several Cariogram components: children in the primary dentition group had worse caries experience, lower salivary secretion rates, less frequent use of fluoridated toothpaste and mouthwash, a less balanced diet, higher meal frequency, and clinical judgments that were usually better than those predicted by the Cariogram. Thus, the null hypothesis of the study was rejected. Campus et al. [34] reported that 50% of Italian children aged 7–9 years were at low risk of caries. Similarly, another study found that 72% of 12-year-old Bosnian children had a moderate risk of caries [35]. In Sweden, low caries risk was observed in 48.9% of 12-year-old children [36], and 50% of 10- and 11-year-old children were also reported to have low risk [13]. Kavvadia et al. [37] evaluated Greek children aged 2–6 years and found that 26% were at risk of caries. Variations in reported caries risk across studies may be attributed to differences in age groups, study populations, racial background, dietary habits, and other contextual factors.
Development and progression of caries occur faster in primary teeth than in permanent teeth [38, 39]. This pattern was also observed in the present study, and may be attributed to factors such as the thinner enamel and larger pulp chamber of primary teeth, higher consumption of carbohydrates especially sticky sugary foods nocturnal bottle-feeding, and generally less parental attention to oral hygiene during the primary dentition period [39,40].
The present results showed a higher frequency of combined use of fluoridated toothpaste and fluoridated mouthwash in children during the mixed dentition period compared to those in the primary dentition period. Interestingly, the proportion of children not using fluoridated mouthwash at all was also higher in the mixed dentition group. The significance and weighting of fluoride use in the Cariogram risk assessment remain topics of debate. Cabral et al. [17] reported that lack of fluoride use had the greatest impact on caries risk assessment outcomes, underscoring the importance of fluoride in caries prevention and control [41]. Similarly, Kim et al. [32] found that children not using fluoridated toothpaste had a significantly higher caries risk (by 12.43 times). The current results indicated a significantly higher salivary secretion rate in children during the mixed dentition period. This finding aligns with previous reports that salivary secretion tends to increase with age [42]. Kim et al. [32], also demonstrated that children with lower salivary secretion rates had a substantially higher risk of developing new carious lesions compared to those with higher salivary flow. In the present study, children in the mixed dentition period had a significantly more balanced diet (score<3) and a lower diet frequency (≤ 5 times per day) compared to those in the primary dentition group. The association between the frequency of fermentable carbohydrate intake and caries risk has been previously reported, particularly in children with poor oral hygiene and insufficient use of fluoride products [43]. Although no consensus exists on the safe frequency of cariogenic food consumption [44], high carbohydrate intake has been linked to increased levels of Streptococcus mutans [45] and a higher risk of caries in preschool children [46]. In the present study, the frequency of children with different risks of caries was almost the same in the primary and mixed dentition periods. However, the clinical judgment similar or worse than that of Cariogram had a higher frequency by 2.19 times in the mixed dentition group. This finding may be due to the fact that only DMFT of children was evaluated in the mixed dentition group, and the results of their DMFT were not entered in the Cariogram, resulting in poorer clinical judgment of dental clinician compared with the Cariogram. Caries experience is a fundamental factor in determination of caries risk, such that some researchers name it as the strongest indicator of caries occurrence [47,48]. Nonetheless, it should be noted that caries experience is an “effect” and not a “cause” for future caries. Thus, it will lose its effect given that preventive measures are taken and the associated risk factors are eliminated [49].
Caries risk assessment is highly important in preschool children and those in the mixed dentition period to prevent new caries [11]. In the present study, 84% of children in the primary dentition period and 49% of those in the mixed dentition period had high and very high risk of caries. These findings highlight the urgent need for targeted preventive strategies, especially in younger children, to effectively reduce the burden of dental caries and promote better oral health outcomes.
In the present study, children in the two groups had no significant difference in family socioeconomic status or parental educational level. Although these factors are not directly included in the Cariogram, they can affect Cariogram components such as diet and use of fluoride products [13].
This study had several limitations. It was conducted at a single center with children from moderate socioeconomic backgrounds, a group likely to have higher treatment needs. Additionally, children of parents who declined participation may have had better oral health, potentially contributing to the observed high caries prevalence. The reliance on parent-reported data for diet, meal frequency, and fluoride use may have introduced inaccuracies. Cooperation during saliva collection was lower among younger children (5–6 years), which could have influenced the results. Convenience sampling was applied, which may introduce selection bias and limit generalizability; however, this approach is common in pediatric clinical research and provides practical feasibility. Moreover, the cross-sectional design provides only a snapshot of caries risk without allowing causal inference or prediction of future disease development, highlighting the need for longitudinal studies. Continuous Cariogram variables such as salivary secretion rate and diet frequency were dichotomized to enable OR calculations and comparability with previous studies. Although this may theoretically reduce statistical power, it enhances interpretability and does not compromise the overall validity of the findings. As multiple comparisons were performed across several Cariogram factors, no formal adjustment for type I error was applied. Although this may increase the likelihood of chance findings, the exploratory nature of the study and consistency with previous Cariogram research justify this approach. Although ORs were calculated to illustrate relative associations, some confidence intervals were wide, reflecting limited precision due to the sample size; therefore, these results should be interpreted with caution. Finally, Streptococcus mutans was not included due to feasibility constraints, but previous validation studies [50–52] have demonstrated that reduced Cariogram models without this parameter still provide acceptable predictive validity, albeit sometimes with slightly reduced accuracy.
Conclusion
Full-Text: (19 Views)
Abstract
Background and Aim: This study compared the caries risk profile of Iranian children in the primary and mixed dentition periods using the Cariogram model.
Materials and Methods: This cross-sectional study was conducted on 200 children in the primary (5-6 years) and mixed (11-12 years) dentition periods (100 participants per group). Data were collected through parental interviews, oral clinical examination, and saliva sampling. All sectors of the Cariogram, except Streptococcus mutans (S. mutans) microbial testing, were evaluated. After obtaining the Cariogram profile of children, their caries risk was estimated and compared between the two groups by t-test. Each Cariogram component was compared between the two groups after controlling for demographic confounders using the regression analysis (alpha=0.05).
Results: In the primary dentition group, 5% of children had very low/low caries risk, 11% had moderate, and 84% had high/very high risk. In the mixed dentition group, 19% had very low/low risk, 32% had moderate, and 49% had high/very high risk. The mean risk of caries was significantly higher in the primary than mixed dentition period (74.92% vs. 56.60%, P=0.002). Caries experience (OR=5.17, P<0.001), salivary secretion (OR=2.61, P=0.002), using a fluoridated toothpaste (OR=2.41, P=0.02), diet (OR=3.14, P=0.01), diet frequency (OR=2.53, P=0.004), and clinical judgment (OR=2.19, P=0.01) were also significantly different between the two groups.
Conclusion: The findings demonstrated that Iranian children in the primary dentition period had a significantly higher risk of caries, associated with higher sugar intake and insufficient fluoride exposure in comparison to children in the mixed dentition period.
Keywords: Dental Caries; Oral Health; Risk Assessment
Introduction
Dental caries is a chronic, complex, and multifactorial disease [1]. Despite a general decline in caries rate among children and adolescents worldwide, its incidence remains variable across different communities [2]. The concept of caries control has changed in the recent years, and a greater emphasis has been placed on the multifactorial nature of caries and the role of biofilm [3]. Primary tooth caries is among the most common diseases worldwide, with hundreds of millions of children affected according to recent global burden of disease estimates. The pattern of dental caries in children depends on the timing of tooth eruption and unhealthy dietary habits. Therefore, age is an important parameter that affects dental caries prevalence in children [4].
An increase in caries prevalence has been reported by the shift from primary dentition to permanent dentition [5]. The first 5-6 years after the eruption of permanent first molars are particularly important. Caries prevalence in the primary dentition period can predict the incidence of caries in permanent first molars [6]. A correlation has been reported between caries experience in the primary and permanent dentition periods. Caries experience in 3 or more primary teeth at the age of 5 years is the best predictor of caries experience in permanent first molars at the age of 7 years [7]. The oral cavity is in a transient stage from the onset of eruption of primary teeth (6-8 months old) until the eruption of permanent second molars (around 12 years of age) [8]. The caries status of newly erupted permanent teeth is correlated with the caries status of primary teeth [9]. Considering the variations in the risk of caries in different age groups, caries risk may be minimized by its estimation in different dentition periods and identification and alteration of influential factors in this regard [10]. Several tools have been proposed for caries risk assessment including the Caries Management by Risk Assessment and Cariogram. The validity of these models has been previously investigated and confirmed in the literature [11-14]. A computerized caries risk assessment model was introduced by Bratthall [15] in 1996 known as the Cariogram to further simplify this process. Cariogram is a software program that assesses the interactive effects of 10 different caries risk factors, including the salivary secretion rate, buffering capacity of the saliva, caries experience, related diseases, diet, diet frequency, fluoride program, clinical judgment, presence of Streptococcus mutans (S. mutans) in the saliva, and plaque quantity. The program calculates and reports the risk of development of new carious lesions in near future, and the overall caries risk of the individual [16]. This program performs its assessments according to 10 pathological and protective factors along with a professional clinical judgment; since some of these factors have a greater correlation with caries development, they are weighted differently [17]. Cariogram is well capable of determination of caries risk, such that it can calculate the caries risk by scoring of only 7 out of 10 factors. Therefore, the performance of smaller models of Cariogram with inclusion of a lower number of factors should also be investigated [15–17].
Despite the wide application of the Cariogram, gaps remain in the literature. Few studies have directly compared caries risk profiles between primary and mixed dentition, and data from Middle Eastern populations are scarce. Simplified Cariogram models omitting microbiological testing have been investigated only in limited pediatric cohorts, and most available studies are cross-sectional, lacking longitudinal validation. These gaps highlight the need for further research in diverse populations. This study aimed to assess and compare the Cariogram profile of Iranian children in primary (5-6 years) and mixed (11-12 years) dentition periods. The null hypothesis of the study was that the Cariogram profile of Iranian children in the primary and mixed dentition periods would not be significantly different.
Materials and Methods
The study protocol was approved by the ethics committee of the university (IR.TUMS. DENTISTRY.REC.1399.254). This cross-sectional study was conducted on 100 children in the primary dentition period (between 5-6 years) and 100 children in the mixed dentition period (11-12 years). The children were selected among those presenting to the Department of Pediatric Dentistry of School of Dentistry, Tehran University of Medical Sciences in 2020-2021 who were selected by convenience sampling.
Sample size calculation:
The required sample size was calculated using standard formulas for quantitative and qualitative variables.
For quantitative outcomes:
n = ((Z_(1-α/2) x standard deviation) / d)^2
with α = 0.05 and d ≤ 0.3 x standard deviation
For proportions:
n = (Z_(1-α/2)^2 x p x (1 - p)) / d^2
with α = 0.05 and d ≤ 0.3 x standard deviation
Based on these calculations and previous studies on caries prevalence [18-26], the minimum required sample size was approximately 100 participants per group. Therefore, a total of 200 children (100 in the primary dentition group and 100 in the mixed dentition group) were included in this study.
Eligibility criteria:
The inclusion criteria were age, parental consent, optimal cooperation of children, and no food or drink intake or tooth brushing for a minimum of 1 hour prior to clinical dental examination. Cooperation was assessed using the Frankl Behavior Rating Scale; children with ratings of 3 (positive) or 4 (definitely positive) were included. The exclusion criterion was poor cooperation, defined as a Frankl rating of 1 (definitely negative) or 2 (negative).
Data collection:
All assessments in this study were conducted in accordance with the official Cariogram guidelines [27]. After obtaining written informed consent from the parents, an interviewer conducted a face-to-face parental interview using a checklist to ask questions about the child’s diet, fluoride program, and presence or absence of underlying systemic conditions. Data collected during the interview included the child’s dietary habits (specifically the consumption of sugary foods and beverages and the frequency of meals and snacks), and oral hygiene practices such as toothbrushing frequency, use of fluoridated toothpaste, and fluoride supplementation. Information on general health status, allergies, and medication use, along with demographic factors including gender, family socioeconomic status, and parental educational level, were also recorded. Following the interview, stimulated saliva samples were collected over a 5-minute period to measure the salivary flow rate and assess the buffering capacity of the saliva. Oral hygiene was evaluated for each child under adequate lighting using a dental mirror and an explorer. Based on the Oral Hygiene Index-Simplified (OHI-S) score, children were categorized into four groups of very good, good, poor, and very poor oral hygiene [28]. Subsequently, the decayed, missing, and filled teeth indices for primary (dmft) and permanent (DMFT) teeth were calculated according to the World Health Organization criteria [29]. These data were entered into the Cariogram model to estimate and report each child’s risk of developing new caries.
The factors evaluated in the Cariogram included caries experience, related diseases, diet contents, diet frequency, plaque quantity, salivary secretion rate, saliva buffering capacity, fluoride program, and clinical judgment, that were measured according to the instructions provided in the Cariogram guide [27]. Based on their calculated caries risk, children were classified into 5 categories: very low (0–20%), low (21–40%), moderate (41–60%), high (61–80%), and very high (81–100%) risk.
Salivary secretion rate: Salivary testing was conducted at the beginning of the treatment session, prior to the administration of any anesthetic agent or other clinical procedures. To ensure reliable results, the child was required to be calm. Stimulated saliva secretion was assessed in accordance with the Cariogram protocol. Each child was asked to chew mastic gum (Trident, Mondelez International, USA) for 5 minutes and expectorate into 15-mL Falcon tubes (Falcon, Corning Inc., USA). The collected saliva was then quantified and scored. All samples were obtained before noon to minimize diurnal variation. Salivary flow rates were categorized according to the Cariogram protocol [27]:
- Score 0 (normal): >1.1 mL/min
- Score 1 (low): 0.9–1.1 mL/min
- Score 2 (very low): 0.5–0.9 mL/min
- Score 3 (severely low): < 0.5 mL/min
Saliva buffering capacity: After saliva collection, pH-indicator strips (Merck, Germany) were immersed in the samples for 1–10 minutes until no further color change was observed. The final color indicated the pH of the sample, which was scored according to the Cariogram protocol [27]:
- Score 0 (sufficient): Normal buffering capacity, pH≥6.0
- Score 1 (decreased): Suboptimal buffering capacity, pH between 4.5 and 5.5
- Score 2 (low): Poor buffering capacity, pH ≤ 4.0
Caries experience (prevalence): Clinical oral examination was conducted under adequate dental unit lighting using a dental mirror and an explorer. All tooth surfaces were thoroughly examined, and all carious lesions and restorations were recorded. The DMFT and dmft indices were subsequently calculated according to the World Health Organization criteria [29]. Scoring in the Cariogram was performed as follows [27]:
- Score 0: No caries, restorations, cavities, or tooth loss due to caries
- Score 1: Better than average for the respective age group
- Score 2: Average for the respective age group
- Score 3: Worse than average for the respective age group, or presence of multiple carious lesions and new caries within the past year
According to the most recent national oral health survey by the Iranian Ministry of Health, the mean dmft in 5–6-year-old Iranian children in 2012 was 4.94, and the mean DMFT was 0.4. For 12-year-olds in Tehran, the mean DMFT was 2 [30]. These values were used as reference standards for scoring in the present study.
Systemic underlying conditions: Based on the information provided by the parents, general health status was scored as follows:
Systemic underlying conditions: Based on the information provided by the parents, general health status was scored as follows:
- Score 0: Healthy, with no systemic condition known to influence dental caries
- Score 1: Mild condition indirectly affecting caries risk (e.g., visual impairment or limited mobility)
- Score 2: Severe or chronic condition with potential impact on salivary flow, such as long-term illness requiring hospitalization or continuous medication use
Diet: This information was obtained from parents during the interview and scored according to the Cariogram guidelines as follows [27]:
- Score 0: Very low intake of fermentable carbohydrates; the child’s diet was considered highly non-cariogenic, containing minimal free sugars and no added sugars in foods or beverages.
- Score 1: Low intake of fermentable carbohydrates; a generally non-cariogenic diet with free sugars or sugary substances consumed only during main meals.
Score 2: Moderate intake of fermentable carbohydrates; the diet included a relatively high number of free sugars or sugary snacks consumed between meals, fewer than three times per day. - Score 3: High intake of fermentable carbohydrates; a cariogenic diet characterized by frequent consumption (three or more times per day) of free sugars and sugary snacks between meals.
Diet frequency: The parents were asked about the frequency of meals of their children during the past 24 hours by using a checklist. The responses were scored according to the Cariogram guidelines as follows [27]:
- Score 0: Very low frequency with a maximum of 3 meals within 24 hours for a long period of time.
- Score 1: Low frequency with a maximum of 5 meals within 24 hours
- Score 2: High frequency with a maximum of 7 meals within 24 hours
- Score 3: Very high frequency with a maximum of more than 7 meals within 24 hours
Plaque quantity: The plaque component of the OHI-S was used, following the Cariogram protocol. In children with primary dentition, the buccal surfaces of teeth #55, 51, 65, and 71, and the lingual surfaces of teeth #75 and 85 were examined. For children in the mixed dentition period, the buccal surfaces of teeth #16, 11, 26, and 31, and the lingual surfaces of teeth #36 and 46 were assessed.
Plaque disclosing agents were first applied, and plaque levels were then quantified by running a dental probe or explorer across the tooth surface from mesial to distal, or vice versa. Scoring was performed according to the Cariogram guidelines as follows [27]:
Plaque disclosing agents were first applied, and plaque levels were then quantified by running a dental probe or explorer across the tooth surface from mesial to distal, or vice versa. Scoring was performed according to the Cariogram guidelines as follows [27]:
- Score 0 (very good): No visible plaque; tooth surfaces were clean, indicating high awareness of oral hygiene and regular brushing/flossing.
- Score 1 (good): Plaque covering less than one-third of the tooth surface.
- Score 2 (moderate): Plaque covering one-third to two-thirds of the tooth surface.
- Score 3 (poor): Plaque covering more than two-thirds of the tooth surface.
The total score for all six teeth was divided by the number of teeth examined to calculate the OHI-S score. For entry into the Cariogram, oral hygiene was categorized as follows:
- Score 0: Excellent oral hygiene (mean OHI-S=0)
- Score 1: Good oral hygiene (mean OHI-S=0.1–1.7)
- Score 2: Acceptable oral hygiene (mean OHI-S=1.8–3.4)
- Score 3: Poor oral hygiene (mean OHI-S=3.5–5)
Fluoride program: Information was collected by interviewing the parents, and scoring was performed according to the Cariogram guidelines as follows [27]:
- Score 0: The patient uses fluoridated toothpaste and regularly receives additional fluoride in the form of tablet, mouthwash, or varnish.
- Score 1: The patient uses fluoridated toothpaste and occasionally receives additional fluoride.
- Score 2: The patient only uses fluoridated toothpaste with no additional fluoride.
- Score 3: The patient does not use any source of fluoride (neither toothpaste nor other forms).
Clinical judgment: This parameter is automatically set to score 1 by the Cariogram software. However, the clinician may override this value and assign a score of 0 if additional preventive measures are being implemented that are not accounted for in the Cariogram. A score of 3 indicates a very high caries risk; in this case, the clinician overrides the Cariogram output based on additional clinical findings not captured in the model, and assumes full responsibility for the caries risk assessment and final decision. The scoring criteria for this parameter are as follows:
- Score 0: Lower risk than indicated by the Cariogram, due to additional preventive measures not included in the model.
- Score 1: As calculated by the Cariogram.
- Score 2: Higher risk than indicated by the Cariogram, based on clinical judgment.
- Score 3: Very high caries risk; the clinician overrides the Cariogram output based on additional clinical findings not captured in the model.
Statistical analysis:
Data was analyzed using SPSS version 25 (SPSS Inc., IL, USA). The Cariogram parameters were compared between the primary and mixed dentition groups after adjusting for demographic confounders gender, parental educational level, and family socioeconomic status using logistic regression analysis. A generalized linear model was applied for quantitative variables. Nine parameters, excluding saliva buffering capacity, were dichotomized to facilitate the calculation of odds ratios (ORs). The overall Cariogram profiles and estimated caries risk were compared between groups using t-test. A P value of less than 0.05 was considered statistically significant.
All participating children and their parents received individualized preventive counseling based on each child’s caries risk profile, including tailored advice on diet, oral hygiene, and fluoride use. When required, referral for appropriate dental treatment was also provided.
Results
Table 1 summarizes the demographic characteristics of the two study groups; while, Table 2 presents the distribution of Cariogram components. In the primary dentition group, 92% of the participants reported no systemic disease. Caries experience worse than normal (the mean dmft index for 5-6- year-old children in Tehran reported to be 4.94 [30]) was observed in 64% of children. Salivary secretion rates of ≥0.5 mL/min were found in 51% of the group, and all participants (100%) exhibited a salivary pH of at least 6.0. OHI-S score greater than 0.1 was recorded in 93% of the group. Regarding fluoride use, 83% either used only fluoridated toothpaste or did not use any fluoride product. In terms of dietary habits, 73% reported consuming carbohydrates only during main meals or less than three times between meals within a 24-hour period. Additionally, 50% had a meal frequency of five times or fewer per 24 hours. Clinical judgment was more favorable than the Cariogram prediction in 58% of the cases. Regarding caries risk assessment, 43% of children were classified as having a high risk; while, 41% were categorized as very high risk.
Table 1. Demographic variables in the two groups
Table 2. Cariogram components in the two groups
In the mixed dentition group, 98% of the participants reported no systemic disease. A normal or better-than-normal caries experience was observed in 71% of the group. Salivary secretion rates of ≥0.5 mL/min were present in 74% of the children, and 99% exhibited a salivary pH of 6. OHI-S score greater than 0.1 was found in 96% of the participants. Regarding fluoride exposure, 71% either used only fluoridated toothpaste or did not use any fluoride product. In terms of carbohydrate consumption, 89% reported intake limited to main meals or fewer than three times between meals over a 24-hour period. Additionally, 74% had a meal frequency of 5 times or fewer per 24 hours. In 57% of the cases, clinical judgment was similar to or less favorable than the Cariogram prediction. Caries risk was classified as moderate in 32% of children, high in 27%, and very high in 22%.
There was a statistically significant difference in overall caries risk between children in the primary and mixed dentition periods, after adjusting for gender, socioeconomic status, and parental educational level. The mean caries risk was significantly higher in the primary dentition group compared to the mixed dentition group (74.92% vs. 56.60%, P<0.001).
In addition, the key components of the Cariogram model susceptibility (P<0.001), circumstances (P<0.001), and diet (P<0.001) were significantly higher in the primary dentition group.
Several significant differences were observed between the primary and mixed dentition groups. The odds of having a salivary secretion rate ≥ 0.5 mL/min were 2.61 times higher in the mixed dentition group compared to the primary dentition group (OR=2.61; 95% CI: 1.42–4.80; P=0.002). The odds of using both fluoridated toothpaste and fluoride mouthwash—regularly or occasionally versus using fluoridated toothpaste alone or no fluoride were also higher in the mixed dentition group (OR=2.41; 95% CI: 1.40–17.96; P=0.02).
Children in the mixed dentition group were more likely to have a balanced diet (score < 3), with odds of 3.14 times higher than those in the primary dentition group (OR=3.14; 95% CI: 1.60–41.99; P=0.01). Additionally, the odds of having a meal frequency of 5 times per day or fewer were 2.53 times higher in this group (OR=2.53; 95% CI: 1.35–4.76; P=0.004).
Caries experience also differed significantly between groups, with the odds of worse-than-normal experience being higher in the primary dentition group (OR=5.17; 95% CI: 2.74–9.74; P<0.001). Clinical judgment scores were more favorable in the mixed dentition group (OR=2.19; 95% CI: 1.20–4.01; P=0.01). No significant differences were found between the groups in terms of systemic disease (P=0.09) or plaque quantity (P=0.67).
Discussion
This study assessed and compared the Cariogram profiles of Iranian children in the primary (5–6 years) and mixed (11–12 years) dentition periods. Nine out of ten Cariogram factors were evaluated, with the Streptococcus mutans count excluded due to its high cost and limited feasibility in routine clinical settings. This limitation reflects the realities of everyday dental practice, where microbial testing is not commonly performed. Notably, previous studies that omitted microbial tests found that their exclusion did not significantly alter Cariogram results [3, 31-33]. The mean caries risk was significantly higher in children in the primary dentition period compared to those in the mixed dentition period (74.92% vs. 56.60%). In the primary dentition group, 43% of children had a high, and 41% had a very high risk of caries; whereas, these figures were 27% and 22%, respectively, in the mixed dentition group. Significant differences were observed between the two groups in several Cariogram components: children in the primary dentition group had worse caries experience, lower salivary secretion rates, less frequent use of fluoridated toothpaste and mouthwash, a less balanced diet, higher meal frequency, and clinical judgments that were usually better than those predicted by the Cariogram. Thus, the null hypothesis of the study was rejected. Campus et al. [34] reported that 50% of Italian children aged 7–9 years were at low risk of caries. Similarly, another study found that 72% of 12-year-old Bosnian children had a moderate risk of caries [35]. In Sweden, low caries risk was observed in 48.9% of 12-year-old children [36], and 50% of 10- and 11-year-old children were also reported to have low risk [13]. Kavvadia et al. [37] evaluated Greek children aged 2–6 years and found that 26% were at risk of caries. Variations in reported caries risk across studies may be attributed to differences in age groups, study populations, racial background, dietary habits, and other contextual factors.
Development and progression of caries occur faster in primary teeth than in permanent teeth [38, 39]. This pattern was also observed in the present study, and may be attributed to factors such as the thinner enamel and larger pulp chamber of primary teeth, higher consumption of carbohydrates especially sticky sugary foods nocturnal bottle-feeding, and generally less parental attention to oral hygiene during the primary dentition period [39,40].
The present results showed a higher frequency of combined use of fluoridated toothpaste and fluoridated mouthwash in children during the mixed dentition period compared to those in the primary dentition period. Interestingly, the proportion of children not using fluoridated mouthwash at all was also higher in the mixed dentition group. The significance and weighting of fluoride use in the Cariogram risk assessment remain topics of debate. Cabral et al. [17] reported that lack of fluoride use had the greatest impact on caries risk assessment outcomes, underscoring the importance of fluoride in caries prevention and control [41]. Similarly, Kim et al. [32] found that children not using fluoridated toothpaste had a significantly higher caries risk (by 12.43 times). The current results indicated a significantly higher salivary secretion rate in children during the mixed dentition period. This finding aligns with previous reports that salivary secretion tends to increase with age [42]. Kim et al. [32], also demonstrated that children with lower salivary secretion rates had a substantially higher risk of developing new carious lesions compared to those with higher salivary flow. In the present study, children in the mixed dentition period had a significantly more balanced diet (score<3) and a lower diet frequency (≤ 5 times per day) compared to those in the primary dentition group. The association between the frequency of fermentable carbohydrate intake and caries risk has been previously reported, particularly in children with poor oral hygiene and insufficient use of fluoride products [43]. Although no consensus exists on the safe frequency of cariogenic food consumption [44], high carbohydrate intake has been linked to increased levels of Streptococcus mutans [45] and a higher risk of caries in preschool children [46]. In the present study, the frequency of children with different risks of caries was almost the same in the primary and mixed dentition periods. However, the clinical judgment similar or worse than that of Cariogram had a higher frequency by 2.19 times in the mixed dentition group. This finding may be due to the fact that only DMFT of children was evaluated in the mixed dentition group, and the results of their DMFT were not entered in the Cariogram, resulting in poorer clinical judgment of dental clinician compared with the Cariogram. Caries experience is a fundamental factor in determination of caries risk, such that some researchers name it as the strongest indicator of caries occurrence [47,48]. Nonetheless, it should be noted that caries experience is an “effect” and not a “cause” for future caries. Thus, it will lose its effect given that preventive measures are taken and the associated risk factors are eliminated [49].
Caries risk assessment is highly important in preschool children and those in the mixed dentition period to prevent new caries [11]. In the present study, 84% of children in the primary dentition period and 49% of those in the mixed dentition period had high and very high risk of caries. These findings highlight the urgent need for targeted preventive strategies, especially in younger children, to effectively reduce the burden of dental caries and promote better oral health outcomes.
In the present study, children in the two groups had no significant difference in family socioeconomic status or parental educational level. Although these factors are not directly included in the Cariogram, they can affect Cariogram components such as diet and use of fluoride products [13].
This study had several limitations. It was conducted at a single center with children from moderate socioeconomic backgrounds, a group likely to have higher treatment needs. Additionally, children of parents who declined participation may have had better oral health, potentially contributing to the observed high caries prevalence. The reliance on parent-reported data for diet, meal frequency, and fluoride use may have introduced inaccuracies. Cooperation during saliva collection was lower among younger children (5–6 years), which could have influenced the results. Convenience sampling was applied, which may introduce selection bias and limit generalizability; however, this approach is common in pediatric clinical research and provides practical feasibility. Moreover, the cross-sectional design provides only a snapshot of caries risk without allowing causal inference or prediction of future disease development, highlighting the need for longitudinal studies. Continuous Cariogram variables such as salivary secretion rate and diet frequency were dichotomized to enable OR calculations and comparability with previous studies. Although this may theoretically reduce statistical power, it enhances interpretability and does not compromise the overall validity of the findings. As multiple comparisons were performed across several Cariogram factors, no formal adjustment for type I error was applied. Although this may increase the likelihood of chance findings, the exploratory nature of the study and consistency with previous Cariogram research justify this approach. Although ORs were calculated to illustrate relative associations, some confidence intervals were wide, reflecting limited precision due to the sample size; therefore, these results should be interpreted with caution. Finally, Streptococcus mutans was not included due to feasibility constraints, but previous validation studies [50–52] have demonstrated that reduced Cariogram models without this parameter still provide acceptable predictive validity, albeit sometimes with slightly reduced accuracy.
Conclusion
The study indicated that children in primary dentition were generally at higher risk compared to those in mixed dentition. These findings highlight the importance of timely and targeted interventions tailored to the child’s dentition stage to effectively reduce caries development and promote long-term oral health.
Type of Study: Original article |
Subject:
pediatric
Send email to the article author
| Rights and permissions | |
 |
This work is licensed under a Creative Commons Attribution-NonCommercial 4.0 International License. |