Journal of Research in Dental
and Maxillofacial Sciences
Volume 10, Issue 3 (9-2025)
J Res Dent Maxillofac Sci 2025, 10(3): 192-202 |
Back to browse issues page


Ethics code: IECVDC/23/PG01/PI/IVV/96
Clinical trials code: CTRI/2023/10/058208
Download citation:
BibTeX | RIS | EndNote | Medlars | ProCite | Reference Manager | RefWorks
Send citation to:


BibTeX | RIS | EndNote | Medlars | ProCite | Reference Manager | RefWorks
Send citation to:
Gottumukkala S, chittabathina P, S Penmetsa G, Satyanarayana Raju M, Ramesh K, Kumar M, et al . Correlation between 3-Dimensional Volumetric Digital Analysis and Direct Technique for Periodontal Phenotype Assessment. J Res Dent Maxillofac Sci 2025; 10 (3) :192-202
URL: http://jrdms.dentaliau.ac.ir/article-1-693-en.html
URL: http://jrdms.dentaliau.ac.ir/article-1-693-en.html
Sruthima Gottumukkala *1 

 , Poornima Chittabathina2 , Gautami S Penmetsa2 , M Satyanarayana Raju3 , KSV Ramesh2 , Mohan Kumar2 , Anil Kumar2 , Murali Krishna4
, Poornima Chittabathina2 , Gautami S Penmetsa2 , M Satyanarayana Raju3 , KSV Ramesh2 , Mohan Kumar2 , Anil Kumar2 , Murali Krishna4
1- Department of Periodontics and Implantology, Vishnu Dental College , sruthima@gmail.com
2- Department of Periodontics and Implantology, Vishnu Dental College
3- Department of Prosthodontics and Implantology, Vishnu Dental College
4- Kumar
2- Department of Periodontics and Implantology, Vishnu Dental College
3- Department of Prosthodontics and Implantology, Vishnu Dental College
4- Kumar
Full-Text [PDF 449 kb]
(551 Downloads)
| Abstract (HTML) (1832 Views)
Full-Text: (571 Views)
Abstract
Background and Aim: Several methods have been used to evaluate gingival thickness (GT); the most often used is the direct technique (DT), which is invasive. Thus, it is necessary to find a novel, reliable, and non-invasive approach for this purpose. This study aimed to evaluate the accuracy of assessment of periodontal phenotype using 3-dimensional digital analysis (digital technique) in comparison with the DT.
Materials and Methods: This cross-sectional study included 30 periodontally healthy participants between 20 and 25 years. One calibrated examiner performed all the measurements. GT and bone thickness (BT) were evaluated at 2 mm (GT2, BT2) and 4 mm (GT4, BT4) apical to the alveolar bone crest around 6 teeth i.e., one molar, one premolar and one incisor in each arch. In the DT, transgingival probing was performed using an endodontic file and a digital vernier caliper. In the digital technique, the DICOM data of cone-beam computed tomography (CBCT) and stereolithography (STL) data were superimposed to perform a digital analysis. Statistical analyses were conducted using the Student's t-test and Pearson’s correlation coefficient (alpha=0.05).
Results: Tooth-wise comparison of GT2, GT4, BT2, and BT4 measurements between the DT and digital technique groups showed very high correlation (r=0.86) for all the included teeth. The GT and BT measurements also showed very high correlation (r>0.8) between the two techniques.
Conclusion: The results showed that digital measurement with STL-DICOM file superimposition was a reliable and reproducible technique comparable to the DT with an endodontic file.
Keywords: Cone-Beam Computed Tomography; Gingiva; Maxilla; Stereolithography
Introduction
Clinical appearance of normal gingival tissue is a reflection of the underlying alveolar bone, lamina propria, and epithelium. While the term "periodontal phenotype" also encompasses the underlying bone morphology, "gingival phenotype" refers to the quality of the soft tissue profile around the tooth [1]. The use of periodontal biotype as a categorization criterion for different morphological characteristics of the human periodontium was proposed by Olsson and Lindhe [2]. The term "periodontal phenotype" was proposed, according to the recommendation of the 2017 World Workshop on the Classification of Periodontal and Peri-Implant Diseases and Conditions [3]. The two prerequisites for this term are bone morphotype (thickness of buccal bone plate) and gingival phenotype, i.e., gingival thickness (GT) and keratinized tissue width. In addition, gingival morphology has been divided into three categories based on the periodontal biotype: "thin-scalloped," "thick-scalloped," and "thick-flat" [1,4]
Several factors influence how periodontal and restorative treatment approaches turn out in terms of final esthetic outcome [4–6]. The most important of them is the examination of the surrounding soft and hard tissues, which is essential for the outcome of restorative and periodontal treatments. Moreover, periodontal phenotype may affect the outcome of orthodontic and restorative treatments [7–10]. The esthetic outcomes of dental implants are highly associated with the gingival biotype (GB). Implant placement should be done in perfect 3-dimensional location along with a thick GB and buccal bone morphotype, especially during immediate implant placement [11]. To prevent buccal bone resorption, a thick labial bone plate at least 1-2 mm in thickness is necessary to preserve implant stability and the soft tissue long-term esthetic results [12]. Furthermore, it has been shown that implants placed buccally with a thinner biotype have a greater likelihood of gingival recession [13,14]. Precise evaluation of the underlying bone thickness (BT) and GT during implant treatment planning is crucial to avoid soft tissue dehiscence and exposure of the implant surface [15].
Many methods, including cone-beam computed tomography (CBCT), probe translucency method, direct technique (DT)/transgingival probing, and ultrasonographic devices, have been used to quantify the GT [16–18]. Despite being inexpensive and simple to apply, the DT has limitations that make it unsuitable for use around multiple teeth. CBCT is the most widely used technique for measuring the BT with great precision [19–21]. However, visualization of soft tissue is limited because of its poor resolution and contrast [22]. The shortcomings of the aforementioned techniques for measurement of GT and BT call for more research in this field.
Digital intraoral scanners allow data to be directly collected from the oral cavity and are widely employed in dentistry. When compared to traditional approaches, digital intraoral scanner images acquired as stereolithographic (STL) files offer higher resolution with more accurate soft tissue outlines, making them suitable for use as a diagnostic tool for evaluation of periodontal phenotype [23, 24]. However, no agreement has yet been achieved on the use of digital intraoral scanners for soft tissue evaluation. Thus, the objective of the current study was to evaluate the precision of periodontal phenotype assessment by using the digital technique in comparison with the conventional DT.
Materials and Methods
Study design and ethical approval:
This cross-sectional study was carried out according to the STROBE guidelines. The Institutional Ethical Committee accepted the study protocol (No- IECVDC/23/PG01/PI/IVV/ 96), which followed the 2013 Helsinki Declaration.
Sample size:
The sample size was calculated to be 30 using G Power 3.1.4 software assuming a study power of 0.80, an alpha level of 0.05, and an effect size of 0.623 based on GT as the primary outcome variable. The study included participants who visited the Department of Periodontics and Implantology from April 2023 to November 2023. Written informed consent was obtained from each patient; they also gave their consent to undergo CBCT for diagnostic purposes (not related to this study).
Inclusion criteria:
A total of 55 patients were initially evaluated; out of which, 30 participants were included. The inclusion criteria were age range of 20 to 50 years, participants with periodontal health (intact periodontium and reduced periodontium) as classified by the World Workshop on the Classification of Periodontal and Peri-Implant Diseases and Conditions in 2017, and systemically healthy subjects with no signs of inflammation, infection, or periapical pathology [25]. Participants with uncontrolled systemic diseases, signs of gingivitis altering the size of gingiva, chronic smokers, pregnancy, puberty and nutritional deficiencies, patients on drugs that could alter the gingiva and bone morphology, presence of any bone disorders or infectious diseases (HIV, hepatitis B, or hepatitis C), and those undergoing radiation therapy were excluded from the study. Presence of tooth-related factors such as presence of traumatic occlusion, crowding or improper alignment of teeth, previous history of orthodontic treatment, endodontically treated teeth, and presence of implants in the location of interest were also among the exclusion criteria.
Periodontal phenotype assessment:
One single calibrated examiner performed all the measurements. Prior to the onset of the study, periodontal phenotype assessment was done for 5 participants who were not included in the current study by a single examiner using both techniques at two intervals, one day apart. GT and BT measurements were considered reproducible if they had a variability of < 5% in ≥ 95% of the recordings [25]. The intra-examiner correlation coefficient (k=0.84) was considered reliable.
GT measurement by the DT:
The gingiva of both the maxillary and mandibular teeth was used for the measurements. Two measurements at 2 mm and 4 mm apical to the alveolar bone crest by transgingival probing through the gingival sulcus were made for each of the maxillary and mandibular molar, premolar, and incisor teeth. The measurements were made on the mid-buccal region perpendicular to the tooth axis.
The gold standard measurement was the transgingival clinical measurement using the DT [26, 27]. The anesthetic gel containing 2% lidocaine (Lignox 2%A; Indoco Remedies Ltd., India) was first applied with a sterile cotton swab. Subsequently, one minute was allowed before a #20 stainless-steel hand K-file (Mani Co., Ltd., Japan) fitted with a rubber stop was introduced into the gingiva at 2 mm and 4 mm apical to the alveolar bone crest in the mid-buccal area of the mandibular and maxillary molar, premolar, and incisor teeth. The file was removed from the gingiva after the rubber stop was secured over the gingival surface. GT was measured by measuring the distance from the file tip to the rubber stop using a digital caliper (Themisto TH-M61 Digital Vernier Caliper, Themisto, India) (Figure 1).
BT measurement on CBCT scans:
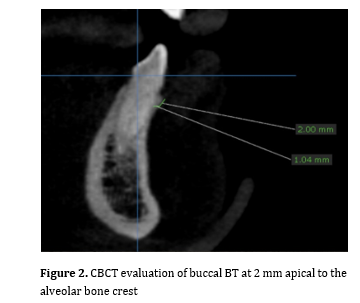
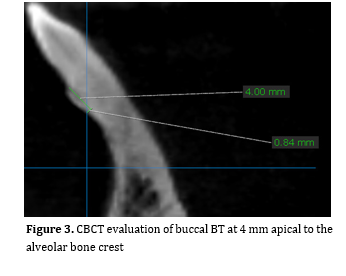
BT was measured on CBCT scans. The lips and cheeks were pulled back using a sterile plastic retractor before scanning (Soredex, Cranex 3D, Biotech innovations Ltd). On Demand software was used for image reconstruction. The labial BT of each tooth was measured in the sagittal plane at 2 mm and 4 mm distances apical to the alveolar crest in the mid-buccal aspect, perpendicular to the tooth axis (Figures 2 and 3).
Figure 1. GT measurement using DT technique
Figure 2. CBCT evaluation of buccal BT at 2 mm apical to the alveolar bone crest
Figure 3. CBCT evaluation of buccal BT at 4 mm apical to the alveolar bone crest
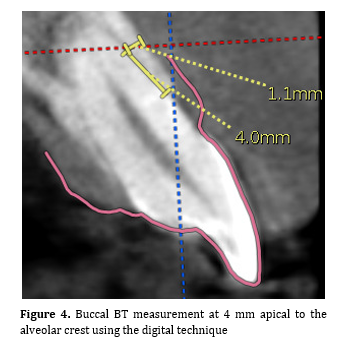
Figure 4. Buccal BT measurement at 4 mm apical to the alveolar crest using the digital technique
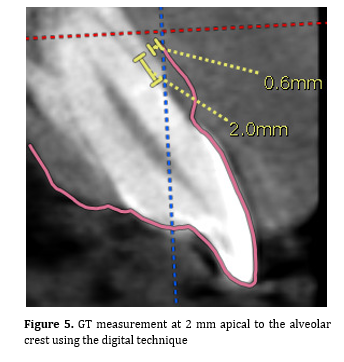
Figure 5. GT measurement at 2 mm apical to the alveolar crest using the digital technique
Results
This cross-sectional study was carried out according to the STROBE guidelines. The Institutional Ethical Committee accepted the study protocol (No- IECVDC/23/PG01/PI/IVV/ 96), which followed the 2013 Helsinki Declaration.
Sample size:
The sample size was calculated to be 30 using G Power 3.1.4 software assuming a study power of 0.80, an alpha level of 0.05, and an effect size of 0.623 based on GT as the primary outcome variable. The study included participants who visited the Department of Periodontics and Implantology from April 2023 to November 2023. Written informed consent was obtained from each patient; they also gave their consent to undergo CBCT for diagnostic purposes (not related to this study).
Inclusion criteria:
A total of 55 patients were initially evaluated; out of which, 30 participants were included. The inclusion criteria were age range of 20 to 50 years, participants with periodontal health (intact periodontium and reduced periodontium) as classified by the World Workshop on the Classification of Periodontal and Peri-Implant Diseases and Conditions in 2017, and systemically healthy subjects with no signs of inflammation, infection, or periapical pathology [25]. Participants with uncontrolled systemic diseases, signs of gingivitis altering the size of gingiva, chronic smokers, pregnancy, puberty and nutritional deficiencies, patients on drugs that could alter the gingiva and bone morphology, presence of any bone disorders or infectious diseases (HIV, hepatitis B, or hepatitis C), and those undergoing radiation therapy were excluded from the study. Presence of tooth-related factors such as presence of traumatic occlusion, crowding or improper alignment of teeth, previous history of orthodontic treatment, endodontically treated teeth, and presence of implants in the location of interest were also among the exclusion criteria.
Periodontal phenotype assessment:
One single calibrated examiner performed all the measurements. Prior to the onset of the study, periodontal phenotype assessment was done for 5 participants who were not included in the current study by a single examiner using both techniques at two intervals, one day apart. GT and BT measurements were considered reproducible if they had a variability of < 5% in ≥ 95% of the recordings [25]. The intra-examiner correlation coefficient (k=0.84) was considered reliable.
GT measurement by the DT:
The gingiva of both the maxillary and mandibular teeth was used for the measurements. Two measurements at 2 mm and 4 mm apical to the alveolar bone crest by transgingival probing through the gingival sulcus were made for each of the maxillary and mandibular molar, premolar, and incisor teeth. The measurements were made on the mid-buccal region perpendicular to the tooth axis.
The gold standard measurement was the transgingival clinical measurement using the DT [26, 27]. The anesthetic gel containing 2% lidocaine (Lignox 2%A; Indoco Remedies Ltd., India) was first applied with a sterile cotton swab. Subsequently, one minute was allowed before a #20 stainless-steel hand K-file (Mani Co., Ltd., Japan) fitted with a rubber stop was introduced into the gingiva at 2 mm and 4 mm apical to the alveolar bone crest in the mid-buccal area of the mandibular and maxillary molar, premolar, and incisor teeth. The file was removed from the gingiva after the rubber stop was secured over the gingival surface. GT was measured by measuring the distance from the file tip to the rubber stop using a digital caliper (Themisto TH-M61 Digital Vernier Caliper, Themisto, India) (Figure 1).
BT measurement on CBCT scans:
BT was measured on CBCT scans. The lips and cheeks were pulled back using a sterile plastic retractor before scanning (Soredex, Cranex 3D, Biotech innovations Ltd). On Demand software was used for image reconstruction. The labial BT of each tooth was measured in the sagittal plane at 2 mm and 4 mm distances apical to the alveolar crest in the mid-buccal aspect, perpendicular to the tooth axis (Figures 2 and 3).
Figure 1. GT measurement using DT technique
Figure 2. CBCT evaluation of buccal BT at 2 mm apical to the alveolar bone crest
Figure 3. CBCT evaluation of buccal BT at 4 mm apical to the alveolar bone crest
Figure 4. Buccal BT measurement at 4 mm apical to the alveolar crest using the digital technique
Figure 5. GT measurement at 2 mm apical to the alveolar crest using the digital technique
Results
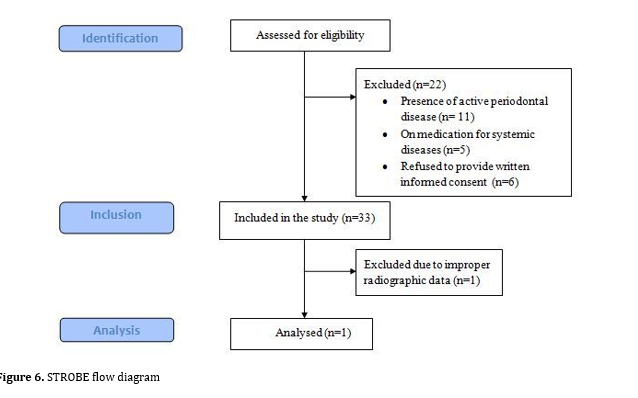
A total of 30 participants comprising of 18 males and 12 females, were selected (Figure 6, STROBE Flow chart). The age of the participants ranged from 29 to 48 years, and their mean age was 36.2±13.2 years. A total of 180 teeth including tooth numbers 16, 24, 21, 36, 41, and 44, were assessed in 30 participants.
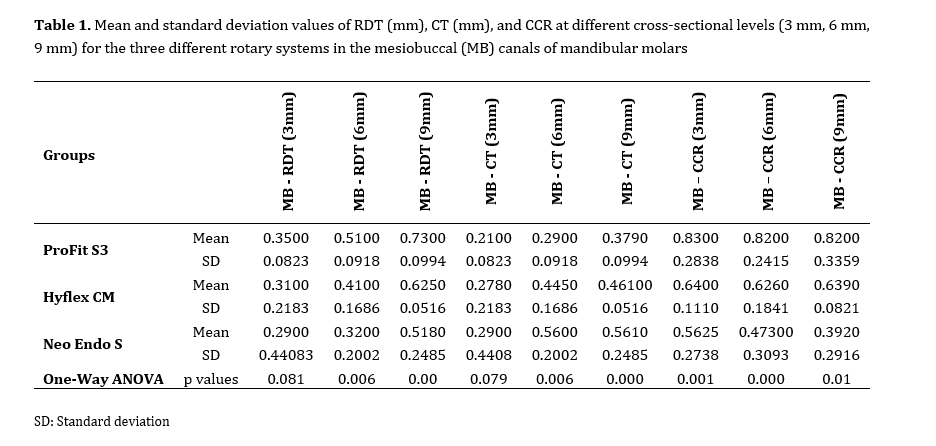
The mean GT2 values tooth-wise were the highest at the first molar region with a mean GT of 2.68±0.33 mm and 2.18±0.38 mm at the site of tooth #36 and #16, respectively. Similarly, the mean GT4 measurements were the highest for the first molar region which was 2.05±0.41 mm and 1.78±0.40 mm at the site of tooth #36 and #16, respectively, using the DT. The lowest GT was recorded at the mandibular incisor region which was 1.27±0.35 mm and 0.93±0.37 mm at GT2 and GT4, respectively using the DT. Tooth-wise comparison of GT2 and GT4 measurements between the DT and digital groups showed very high (r>0.8) to moderate (r>0.4) correlation according to Pearson’s correlation coefficient for all the included teeth (Table 1).
Tooth-wise comparison of BT between the DT and modified CBCT groups showed the greatest BT at the site of tooth #16 region which was 1.74±0.46 mm and 1.58±0.58 mm for BT2 and BT4, respectively. The lowest BT was seen at the site of tooth #41 with a mean value of 1.20±0.20 mm and 1.17±0.28 mm for BT2 and BT4, respectively. Tooth-wise comparison of BT2 and BT4 measurements between the DT and modified CBCT groups showed very high correlation (r>0.8) for most of the included teeth. The correlation between DT and DGT in BT was highly significant (P=0.00) for all the included teeth (Table 2).
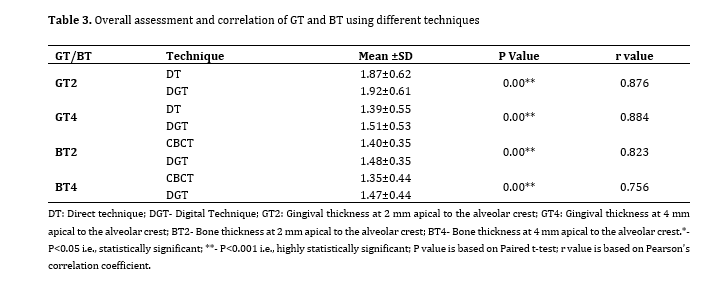
Overall assessment of GT using different techniques showed greater GT2 values i.e., 1.87±0.62 mm and 1.92±0.61 mm using the DT and digital technique, respectively, compared to GT4 values i.e., 1.39±0.55 mm and 1.51±0.53 mm using the DT and digital techniques, respectively with a highly significant correction between the two techniques at GT2 (r=-0.876, P=0.00) and GT4 (r=-0.884, P=0.00). Similarly, the BT values showed a high correlation between the two groups at BT2 (r=-0.823, P=0.00) and BT4 (r=-0.756, P=0.00) (Table 3).
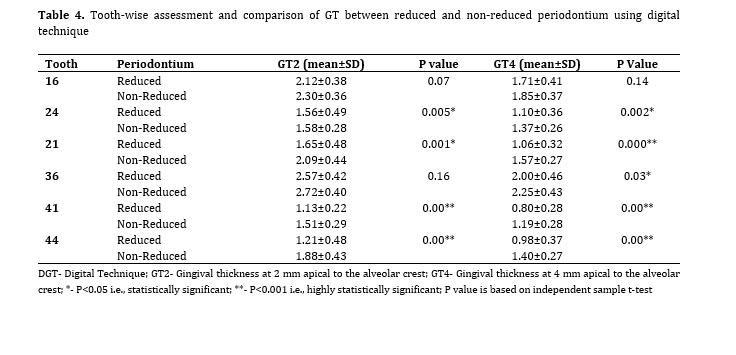
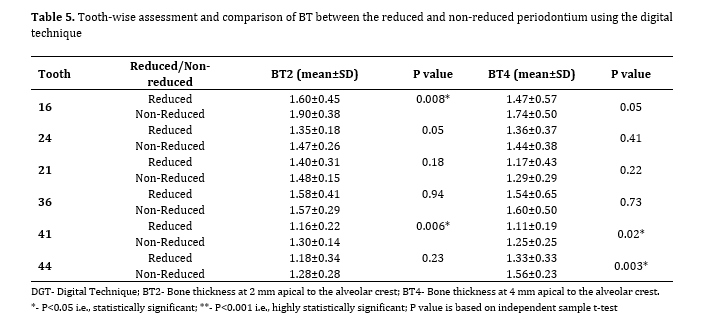
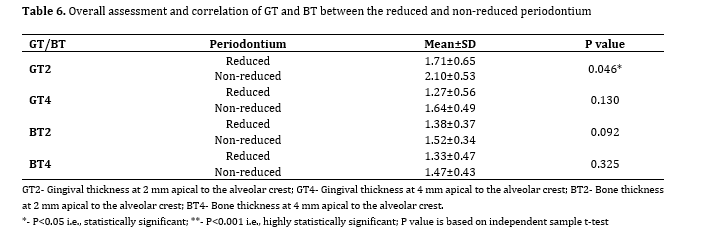
Tooth-wise assessment of GT between the reduced and non-reduced healthy periodontium groups showed a highly significant difference in GT2 and GT4 values in teeth #21 (P=0.001, P=0.000), #41 (P-0.00, P=0.00), #44 (P=0.00, P=0.00), and #24 (P=0.005, P=0.002) regions. No significant difference in GT was found between the reduced and non-reduced periodontium in tooth #16 (P=0.07, P=0.14) at GT2 or GT4 (Table 4). Tooth-wise assessment and comparison of BT between the reduced and non-reduced periodontium using the digital technique showed a significant difference in BT2 and BT4 at teeth #41, 44, and 16, with a lower BT in reduced periodontium (Table 5). Overall assessment and correlation of GT and BT between the reduced and non-reduced periodontium showed a significant difference only at GT2 (P=0.046) with lower thickness in reduced periodontium (1.71±0.65 mm) compared to non-reduced periodontium (2.10±0.53 mm; Table 6).
Figure 6. STROBE flow diagram
Table 1. Tooth-wise assessment and correlation of different techniques regarding GT
Table 2. Tooth-wise assessment and correlation of different techniques regarding BT
Table 3. Overall assessment and correlation of GT and BT using different techniques
Table 4. Tooth-wise assessment and comparison of GT between reduced and non-reduced periodontium using digital technique
Table 5. Tooth-wise assessment and comparison of BT between the reduced and non-reduced periodontium using the digital technique
Table 6. Overall assessment and correlation of GT and BT between the reduced and non-reduced periodontium
Discussion
The mean GT2 values tooth-wise were the highest at the first molar region with a mean GT of 2.68±0.33 mm and 2.18±0.38 mm at the site of tooth #36 and #16, respectively. Similarly, the mean GT4 measurements were the highest for the first molar region which was 2.05±0.41 mm and 1.78±0.40 mm at the site of tooth #36 and #16, respectively, using the DT. The lowest GT was recorded at the mandibular incisor region which was 1.27±0.35 mm and 0.93±0.37 mm at GT2 and GT4, respectively using the DT. Tooth-wise comparison of GT2 and GT4 measurements between the DT and digital groups showed very high (r>0.8) to moderate (r>0.4) correlation according to Pearson’s correlation coefficient for all the included teeth (Table 1).
Tooth-wise comparison of BT between the DT and modified CBCT groups showed the greatest BT at the site of tooth #16 region which was 1.74±0.46 mm and 1.58±0.58 mm for BT2 and BT4, respectively. The lowest BT was seen at the site of tooth #41 with a mean value of 1.20±0.20 mm and 1.17±0.28 mm for BT2 and BT4, respectively. Tooth-wise comparison of BT2 and BT4 measurements between the DT and modified CBCT groups showed very high correlation (r>0.8) for most of the included teeth. The correlation between DT and DGT in BT was highly significant (P=0.00) for all the included teeth (Table 2).
Overall assessment of GT using different techniques showed greater GT2 values i.e., 1.87±0.62 mm and 1.92±0.61 mm using the DT and digital technique, respectively, compared to GT4 values i.e., 1.39±0.55 mm and 1.51±0.53 mm using the DT and digital techniques, respectively with a highly significant correction between the two techniques at GT2 (r=-0.876, P=0.00) and GT4 (r=-0.884, P=0.00). Similarly, the BT values showed a high correlation between the two groups at BT2 (r=-0.823, P=0.00) and BT4 (r=-0.756, P=0.00) (Table 3).
Tooth-wise assessment of GT between the reduced and non-reduced healthy periodontium groups showed a highly significant difference in GT2 and GT4 values in teeth #21 (P=0.001, P=0.000), #41 (P-0.00, P=0.00), #44 (P=0.00, P=0.00), and #24 (P=0.005, P=0.002) regions. No significant difference in GT was found between the reduced and non-reduced periodontium in tooth #16 (P=0.07, P=0.14) at GT2 or GT4 (Table 4). Tooth-wise assessment and comparison of BT between the reduced and non-reduced periodontium using the digital technique showed a significant difference in BT2 and BT4 at teeth #41, 44, and 16, with a lower BT in reduced periodontium (Table 5). Overall assessment and correlation of GT and BT between the reduced and non-reduced periodontium showed a significant difference only at GT2 (P=0.046) with lower thickness in reduced periodontium (1.71±0.65 mm) compared to non-reduced periodontium (2.10±0.53 mm; Table 6).
Figure 6. STROBE flow diagram
Table 1. Tooth-wise assessment and correlation of different techniques regarding GT
Table 2. Tooth-wise assessment and correlation of different techniques regarding BT
Table 3. Overall assessment and correlation of GT and BT using different techniques
Table 4. Tooth-wise assessment and comparison of GT between reduced and non-reduced periodontium using digital technique
Table 5. Tooth-wise assessment and comparison of BT between the reduced and non-reduced periodontium using the digital technique
Table 6. Overall assessment and correlation of GT and BT between the reduced and non-reduced periodontium
Discussion
The gold standard for determining the GB has traditionally been the direct measurement of soft tissue around teeth and implants with endodontic files or probes. Despite being a straightforward, dependable, and widely utilized procedure, the DT is problematic because of its invasive nature. Previous research has examined the use of alternative non-invasive techniques, including ultrasonography to measure the GT [29]. However, it might be difficult to rely on such a technique and use it easily, particularly in the posterior region. The non-invasive, reliable, and predictable characteristics of the digital superimposition approach have been recently validated.
Tooth-wise comparisons of GT between the DT and digital groups revealed a very high (r>0.8) to moderate (r>0.4) correlation indicating the validity of DICOM-STL superimposition as a diagnostic tool for soft tissue evaluation. A highly significant correlation was seen between the DT and digital technique for overall GT measurements at GT2 and GT4. A reliable and reproducible technique for digital measurement of the GT is the STL-DICOM file superimposition approach, which is similar to direct transmucosal probing approach with an endodontic spreader. A previous study examined the relationships between GT and BT along with other factors in different types of teeth (canines, lateral, and central incisors) using a digital approach. The BT and GT at the alveolar crest level had a significant correlation [28]. In contrast to earlier research, the present study included incisors, premolars, and molars in both arches. This was done to reduce bias and evaluate associations between all tooth types.
The significant agreement between the DT and digital technique, as noted in an earlier study by Couso-Queiruga et al. [30] in 2021, was one of the key findings of the present study. Since soft tissue analysis on CBCT scans may not be able to distinguish between gingival tissue and the facial vestibule due to factors like collapsed vestibules (i.e., overlapping of lip/cheek) in most cases, soft tissue thickness measurements on CBCT images were not included in the present study.
Tooth-wise comparison of CBCT and digital groups regarding BT2 and BT4 data revealed a very strong correlation for the majority of the included teeth. Similarly, overall BT values at BT2 and BT4 revealed strong correlations between the groups. Many studies that found a favorable link between GT and labial BT did so by measuring the GT at the supracrestal level and BT under the alveolar crest [31,32]. Additionally, comparisons were not made at the same levels in their study. In order to compare with earlier research, the correlation between the GT and BT was analyzed at two distinct depths (GT2, GT4, BT2, and BT4). A prior study assessed the association at several depth levels, ranging from 0 to 5 mm, and discovered a strong correlation at all depths, especially at the canine and lateral incisor teeth [28]. A cross-sectional study by Mascardo et al. [33] in 2024 evaluated the risk indicators associated with mid-facial gingival recession in the esthetic zone using the digital technique and high frequency ultrasonography and reported that ultrasonography may be preferred for a non-invasive periodontal phenotype assessment. However, the same may not be applicable to posterior regions due to the difficulty in utilizing of ultrasonography transducer in the posterior areas.
When compared to direct clinical measurements, the primary drawback of digital measurements may be that it takes longer to collect the datasets and conduct the actual assessments. To prevent measurement errors, the files must also be suitably combined, and a careful evaluation procedure that calls for experience and training must be followed. It is possible for digital measurements to have some errors, which may result in data that are not trustworthy. But it is important to recognize that these issues are typically related to the usage of subpar digital data (such as artifacts), insufficient file processing, and an inaccurate or non-standardized radiographic technique.
Conclusion
The results showed that periodontal phenotype measurement using the digital technique with superimposed files is a reliable and reproducible technique that may be comparable to direct transmucosal probing performed with an endodontic spreader.
Clinical significance
In clinical practice, STL-CBCT file superimposition-based evaluations may be utilized as a non-invasive, reliable, and reproducible substitute for invasive methods for assessment of the necessity of periodontal and peri-implant phenotype alteration during treatment planning and maintenance. It can also be used to reliably analyze soft tissue changes over time to determine the outcomes of mucogingival surgery in research settings.
Type of Study: Original article |
Subject:
Periodontology
References
1. Malpartida-Carrillo V, Tinedo-Lopez PL, Guerrero ME, Amaya-Pajares SP, Özcan M, Rösing CK. Periodontal phenotype: A review of historical and current classifications evaluating different methods and characteristics. J Esthet Restor Dent. 2021 Apr;33(3):432-45. [DOI:10.1111/jerd.12661] [PMID]
2. Olsson M, Lindhe J. Periodontal characteristics in individuals with varying form of the upper central incisors. J Clin Periodontol. 1991 Jan;18(1):78-82. [DOI:10.1111/j.1600-051X.1991.tb01124.x] [PMID]
3. Jepsen S, Caton JG, Albandar JM, Bissada NF, Bouchard P, Cortellini P, et al. Periodontal manifestations of systemic diseases and developmental and acquired conditions: Consensus report of workgroup 3 of the 2017 World Workshop on the Classification of Periodontal and Peri-Implant Diseases and Conditions. J Clin Periodontol. 2018 Jun;45.
4. Fu JH, Yeh CY, Chan HL, Tatarakis N, Leong DJ, Wang HL. Tissue biotype and its relation to the underlying bone morphology. J Periodontol. 2010 Apr;81(4):569-74. [DOI:10.1902/jop.2009.090591] [PMID]
5. Hwang D, Wang HL. Flap thickness as a predictor of root coverage: a systematic review. J Periodontol. 2006 Oct;77(10):1625-34. [DOI:10.1902/jop.2006.060107] [PMID]
6. Yin XJ, Wei BY, Ke XP, Zhang T, Jiang MY, Luo XY, et al. Correlation between clinical parameters of crown and gingival morphology of anterior teeth and periodontal biotypes. BMC Oral Health. 2020 Feb 19;20(1):59. [DOI:10.1186/s12903-020-1040-x] [PMID] []
7. Kwon TH, Salem DM, Levin L. Periodontal considerations in orthodontic treatment: A review of the literature and recommended protocols. InSeminars in Orthodontics 2024 Jan 18. [DOI:10.1053/j.sodo.2024.01.011]
8. Al-Thomali Y, Mohamed RN, Basha S, Setty R, Manasali BS. Gingival Biotype and Its Relation with Malocclusion. Turk J Orthod. 2023 Mar 21;36(1):70-7. [DOI:10.4274/TurkJOrthod.2022.2021.0054] [PMID] []
9. Liu Z, Li C, Liu Y, Zeng J, Chu H, Chen P, Zhou T, Yin W, Rong M. The clinical significance and application of the peri-implant phenotype in dental implant surgery: a narrative review. Ann Transl Med. 2023 Aug 30;11(10):351. [DOI:10.21037/atm-23-1752] [PMID] []
10. Wang II, Barootchi S, Tavelli L, Wang HL. The peri-implant phenotype and implant esthetic complications. Contemporary overview. J Esthet Restor Dent. 2021 Jan;33(1):212-23. [DOI:10.1111/jerd.12709] [PMID]
11. Ioannou AL, Kotsakis GA, McHale MG, Lareau DE, Hinrichs JE, Romanos GE. Soft Tissue Surgical Procedures for Optimizing Anterior Implant Esthetics. Int J Dent. 2015;2015:740764. [DOI:10.1155/2015/740764] [PMID] []
12. Grunder U, Gracis S, Capelli M. Influence of the 3-D bone-to-implant relationship on esthetics. Int J Periodontics Restorative Dent. 2005 Apr;25(2):113-9.
13. Evans CD, Chen ST. Esthetic outcomes of immediate implant placements. Clin Oral Implants Res. 2008 Jan;19(1):73-80. [DOI:10.1111/j.1600-0501.2007.01413.x] [PMID]
14. Bengazi F, Wennström JL, Lekholm U. Recession of the soft tissue margin at oral implants. A 2-year longitudinal prospective study. Clin Oral Implants Res. 1996 Dec;7(4):303-10. [DOI:10.1034/j.1600-0501.1996.070401.x] [PMID]
15. Fu JH, Lee A, Wang HL. Influence of tissue biotype on implant esthetics. Int J Oral Maxillofac Implants. 2011 May-Jun;26(3):499-508.
16. Fu JH, Yeh CY, Chan HL, Tatarakis N, Leong DJ, Wang HL. Tissue biotype and its relation to the underlying bone morphology. J Periodontol. 2010 Apr;81(4):569-74. [DOI:10.1902/jop.2009.090591] [PMID]
17. Müller HP, Schaller N, Eger T. Ultrasonic determination of thickness of masticatory mucosa: a methodologic study. Oral Surg Oral Med Oral Pathol Oral RadiolEndod. 1999 Aug;88(2):248-53. [DOI:10.1016/S1079-2104(99)70123-X] [PMID]
18. Olsson M, Lindhe J, Marinello CP. On the relationship between crown form and clinical features of the gingiva in adolescents. J Clin Periodontol. 1993 Sep;20(8):570-7. [DOI:10.1111/j.1600-051X.1993.tb00773.x] [PMID]
19. Timock AM, Cook V, McDonald T, Leo MC, Crowe J, Benninger BL, Covell DA Jr. Accuracy and reliability of buccal bone height and thickness measurements from cone-beam computed tomography imaging. Am J Orthod Dentofacial Orthop. 2011 Nov;140(5):734-44. [DOI:10.1016/j.ajodo.2011.06.021] [PMID]
20. Esfahanizadeh N, Daneshparvar N, Askarpour F, Akhoundi N, Panjnoush M. Correlation Between Bone and Soft Tissue Thickness in Maxillary Anterior Teeth. J Dent (Tehran). 2016 Sep;13(5):302-8.
21. González-Martín O, Oteo C, Ortega R, Alandez J, Sanz M, Veltri M. Evaluation of peri-implant buccal bone by computed tomography: an experimental study. Clin Oral Implants Res. 2016 Aug;27(8):950-5. [DOI:10.1111/clr.12663] [PMID]
22. Fischer KR, Grill E, Jockel-Schneider Y, Bechtold M, Schlagenhauf U, Fickl S. On the relationship between gingival biotypes and supracrestal gingival height, crown form and papilla height. Clin Oral Implants Res. 2014 Aug;25(8):894-8. [DOI:10.1111/clr.12196] [PMID]
23. Schoenbaum TR. Decoding CAD/CAM and digital impression units. Dent Today. 2010 Feb;29(2):140-5.
24. Qu F, Huang YJ, Wang YY, Cao XM, Shen YY, Wu ZA, Wu YQ, Xu C. Cone-beam CT evaluation of post-extraction alveolar bone changes at the maxillary incisor sites in an East Asian population: A cross-sectional study. Heliyon. 2024 May 29;10(11):e32027. [DOI:10.1016/j.heliyon.2024.e32027] [PMID] []
25. Wang L, Ruan Y, Chen J, Luo Y, Yang F. Assessment of the relationship between labial gingival thickness and the underlying bone thickness in maxillary anterior teeth by two digital techniques. Sci Rep. 2022 Jan 13;12(1):709. [DOI:10.1038/s41598-021-04721-7] [PMID] []
26. El Khalifa M, Abu El Sadat SM, Gaweesh YS, Gaweesh YY. Assessment of Gingival Thickness Using CBCT Compared to Transgingival Probing and Its Correlation with Labial Bone Defects: A Cross-Sectional Study. Int J Oral Maxillofac Implants. 2022 May-Jun;37(3):464-72. [DOI:10.11607/jomi.9234] [PMID]
27. Wang J, Cha S, Zhao Q, Bai D. Methods to assess tooth gingival thickness and diagnose gingival phenotypes: A systematic review. J Esthet Restor Dent. 2022 Jun;34(4): 620-32. [DOI:10.1111/jerd.12900] [PMID]
28. Kim YJ, Park JM, Kim S, Koo KT, Seol YJ, Lee YM, Rhyu IC, Ku Y. New method of assessing the relationship between buccal bone thickness and gingival thickness. J Periodontal Implant Sci. 2016 Dec;46(6):372-81. [DOI:10.5051/jpis.2016.46.6.372] [PMID] []
29. Soltani P, Yaghini J, Rafiei K, Mehdizadeh M, Armogida NG, Esposito L, Spagnuolo G. Comparative Evaluation of the Accuracy of Gingival Thickness Measurement by Clinical Evaluation and Intraoral Ultrasonography. J Clin Med. 2023 Jun 29;12(13):4395. [DOI:10.3390/jcm12134395] [PMID] []
30. Couso-Queiruga E, Tattan M, Ahmad U, Barwacz C, Gonzalez-Martin O, Avila-Ortiz G. Assessment of gingival thickness using digital file superimposition versus direct clinical measurements. Clin Oral Investig. 2021 Apr;25(4):2353-61. [DOI:10.1007/s00784-020-03558-0] [PMID]
31. Stein JM, Lintel-Höping N, Hammächer C, Kasaj A, Tamm M, Hanisch O. The gingival biotype: measurement of soft and hard tissue dimensions - a radiographic morphometric study. J Clin Periodontol. 2013 Dec;40(12):1132-9. [DOI:10.1111/jcpe.12169] [PMID]
32. La Rocca AP, Alemany AS, Levi P Jr, Juan MV, Molina JN, Weisgold AS. Anterior maxillary and mandibular biotype: relationship between gingival thickness and width with respect to underlying bone thickness. Implant Dent. 2012 Dec;21(6):507-15. [DOI:10.1097/ID.0b013e318271d487] [PMID]
33. Mascardo KC, Tomack J, Chen CY, Mancini L, Kim DM, Friedland B, Barootchi S, Tavelli L. Risk indicators for gingival recession in the esthetic zone: A cross-sectional clinical, tomographic, and ultrasonographic study. J Periodontol. 2024 May;95(5):432-43. [DOI:10.1002/JPER.23-0357] [PMID]
Send email to the article author
| Rights and permissions | |
 |
This work is licensed under a Creative Commons Attribution-NonCommercial 4.0 International License. |