Journal of Research in Dental
and Maxillofacial Sciences
Volume 7, Issue 4 (10-2022)
J Res Dent Maxillofac Sci 2022, 7(4): 210-218 |
Back to browse issues page


Ethics code: IR.mums.REC.1392.209
Download citation:
BibTeX | RIS | EndNote | Medlars | ProCite | Reference Manager | RefWorks
Send citation to:


BibTeX | RIS | EndNote | Medlars | ProCite | Reference Manager | RefWorks
Send citation to:
Imanimoghaddam M, Bagherpour A, Madani A, Foroozandeh M, Hafez Maleki F, Alimohammadi M et al . Correlation of Bone Mineral Density and Fractal Analysis of the Mandibular Condyle in Women with Temporomandibular Joint Osteoarthritis: A Pilot Study. J Res Dent Maxillofac Sci 2022; 7 (4) :210-218
URL: http://jrdms.dentaliau.ac.ir/article-1-394-en.html
URL: http://jrdms.dentaliau.ac.ir/article-1-394-en.html
M Imanimoghaddam1 

 , A Bagherpour *2 , A Madani3 , M Foroozandeh4 , F Hafez Maleki4 , M Alimohammadi5 , SH Moeini1
, A Bagherpour *2 , A Madani3 , M Foroozandeh4 , F Hafez Maleki4 , M Alimohammadi5 , SH Moeini1
1- Department of Oral and Maxillofacial Radiology, School of Dentistry, Mashhad University of Medical Sciences, Mashhad, Iran
2- Department of Oral and Maxillofacial Radiology, School of Dentistry, Mashhad University of Medical Sciences, Mashhad, Iran ,bagherpoura@mums.ac.ir
3- Department of Prosthodontics, School of Dentistry, Mashhad University of Medical Sciences, Mashhad, Iran
4- Department of Oral and Maxillofacial Radiology, Dental School, Hamadan University of Medical Sciences, Hamadan, Iran
5- Department of Oral and Maxillofacial Radiology, School of Dentistry, Mazandaran University of Medical Sciences, Sari, Iran
2- Department of Oral and Maxillofacial Radiology, School of Dentistry, Mashhad University of Medical Sciences, Mashhad, Iran ,
3- Department of Prosthodontics, School of Dentistry, Mashhad University of Medical Sciences, Mashhad, Iran
4- Department of Oral and Maxillofacial Radiology, Dental School, Hamadan University of Medical Sciences, Hamadan, Iran
5- Department of Oral and Maxillofacial Radiology, School of Dentistry, Mazandaran University of Medical Sciences, Sari, Iran
Full-Text [PDF 861 kb]
(1223 Downloads)
| Abstract (HTML) (3697 Views)
Introduction
Dual energy X-ray absorptiometry (DEXA) is the gold standard for measuring bone mineral density (BMD). This method is fast and non-invasive, does not require anesthesia or preparation, and is available in most medical centers around the world. It uses two X-ray beams with different energy levels; whereby, the degree of attenuation of the X-ray beam by the scanned bone is measured [1,2]. The routine methods for assessment of BMD such as DEXA are costly and have some difficulties. Therefore, researchers are looking for new techniques to assess the morphology of trabecular bone [3,4].
Fractal analysis is a non-invasive method for quantification of the changes in trabecular structure of cancellous bone [5,6]. Measurement of fractal dimension (FD) can reveal the complexity of trabecular bone and its structure and may be used to detect osteoporotic patients. According to Geraets et al, [6] FD is similar to DEXA and quantitative computed tomography (CT) in effectiveness. Quantitative CT is a BMD measurement technique that calibrates the CT scanner by using solid phantoms made from calcium hydroxyapatite that represent various BMDs, and are placed in a pad beneath the patient [6].
The difference between the fractal analysis of patients and healthy individuals has been controversial in the literature. For instance, Hua et al. [7] reported that FD increased in pathologies that cause osteoporosis-like effects on trabecular bone. Temporomandibular joint osteoarthritis (TMJOA) is a chronic degenerative joint disease that causes destructive changes in the fossa and on the articular surface of the mandibular condyle. Therefore, the density of the condyle could be useful in assessing BMD, which can be affected in TMJOA.
Kayipmaz et al. [8] examined the trabecular structure of the subcortical area of the mandibular condyle and found a low FD in all patients with osteophyte formation, generalized and local sclerosis, subchondral cysts, and erosion in early and advanced stages of TMJOA. They concluded that a FD analysis can be used as an auxiliary method for early detection of TMJOA [8].
TMJOA is the leading cause of temporomandibular disorders (TMDs). It has the highest prevalence in women and the elderly, and is characterized by varying degrees of inflammation and resorption of the articular cartilage and bone [9]. Considering the importance of early detection of skeletal changes in TMJOA for prevention of irreversible and extensive bone destruction, fractal analysis may be useful for assessment of bone trabecular changes in TMJ in early stages of the disease [10]. Therefore, this study aimed to investigate the correlation between BMD and FD of the mandibular condyle in TMJOA women using cone-beam computed tomography (CBCT).
Materials and Methods
This cross-sectional study was conducted on 19 patients aged 20 to 40 years without systemic disease and normal menstrual status, who were classified in group III of research diagnostic criteria for temporomandibular disorders. The study was approved by the Ethics Committee of Mashhad University of Medical Sciences (IR.MUMS.REC.1392.209). Since the participants were between 20 to 40 years and had no systemic disease, symptoms of osteoporosis, or bone pain, they declined DEXA test. This was the main reason for the small sample size in this study.
1. The American Academy of Orofacial Pain uses capsulitis and synovitis as criteria for TMJ pain [11]. The patients were selected using non-probability sampling based on clinical evaluation by a prosthodontist. The patients had signs of osteoarthritis in both joints. In addition, 20 healthy women with no clinical or radiographic signs/symptoms of TMDs who referred for other dental problems were also included as healthy controls. All participants took part in the study after signing informed consent forms.
Full-Text: (1723 Views)
| Abstract
Background and Aim: Temporomandibular joint osteoarthritis (TMJOA) appears to be more common in osteoporotic patients. Fractal analysis is a mathematical method that can be used to assess trabecular bone. The aim of this study was to assess the correlation of bone mineral density (BMD) and fractal dimension (FD) of the condyles in women with TMJOA using cone-beam computed tomography (CBCT). Materials and Methods: In this cross-sectional study, the FD and lacunarity of the condylar head were assessed on CBCT images of 39 women (20 healthy women with no signs/symptoms of TMJOA, and 19 TMJOA patients). The BMD and the T-score of the hip and lumbar vertebrae were determined using dual energy X-ray absorptiometry. Data were analyzed by t-test, chi-square test, and Pearson’s correlation coefficient. Results: TMJOA patients and healthy controls did not differ significantly in terms of the mean age (P=0.63), BMD and T-score (P>0.05), or FD and lacunarity (P>0.05). A significant correlation was observed, however, between lacunarity in the two condyles (r=0.47, P=0.003) and BMD of the lumbar vertebrae and the hip (r=0.40, P=0.01). Conclusion: The mean BMD of total spine and hip did not differ significantly in the two groups of healthy controls and TMJOA patients. The FD and lacunarity also showed no significant difference between the groups. FD based on CBCT images of the TMJ is not a reliable indicator for categorization of skeletal status. Key Words: Osteoarthritis; Fractals; Cone-Beam Computed Tomography; Bone Density |
Introduction
Dual energy X-ray absorptiometry (DEXA) is the gold standard for measuring bone mineral density (BMD). This method is fast and non-invasive, does not require anesthesia or preparation, and is available in most medical centers around the world. It uses two X-ray beams with different energy levels; whereby, the degree of attenuation of the X-ray beam by the scanned bone is measured [1,2]. The routine methods for assessment of BMD such as DEXA are costly and have some difficulties. Therefore, researchers are looking for new techniques to assess the morphology of trabecular bone [3,4].
Fractal analysis is a non-invasive method for quantification of the changes in trabecular structure of cancellous bone [5,6]. Measurement of fractal dimension (FD) can reveal the complexity of trabecular bone and its structure and may be used to detect osteoporotic patients. According to Geraets et al, [6] FD is similar to DEXA and quantitative computed tomography (CT) in effectiveness. Quantitative CT is a BMD measurement technique that calibrates the CT scanner by using solid phantoms made from calcium hydroxyapatite that represent various BMDs, and are placed in a pad beneath the patient [6].
The difference between the fractal analysis of patients and healthy individuals has been controversial in the literature. For instance, Hua et al. [7] reported that FD increased in pathologies that cause osteoporosis-like effects on trabecular bone. Temporomandibular joint osteoarthritis (TMJOA) is a chronic degenerative joint disease that causes destructive changes in the fossa and on the articular surface of the mandibular condyle. Therefore, the density of the condyle could be useful in assessing BMD, which can be affected in TMJOA.
Kayipmaz et al. [8] examined the trabecular structure of the subcortical area of the mandibular condyle and found a low FD in all patients with osteophyte formation, generalized and local sclerosis, subchondral cysts, and erosion in early and advanced stages of TMJOA. They concluded that a FD analysis can be used as an auxiliary method for early detection of TMJOA [8].
TMJOA is the leading cause of temporomandibular disorders (TMDs). It has the highest prevalence in women and the elderly, and is characterized by varying degrees of inflammation and resorption of the articular cartilage and bone [9]. Considering the importance of early detection of skeletal changes in TMJOA for prevention of irreversible and extensive bone destruction, fractal analysis may be useful for assessment of bone trabecular changes in TMJ in early stages of the disease [10]. Therefore, this study aimed to investigate the correlation between BMD and FD of the mandibular condyle in TMJOA women using cone-beam computed tomography (CBCT).
Materials and Methods
This cross-sectional study was conducted on 19 patients aged 20 to 40 years without systemic disease and normal menstrual status, who were classified in group III of research diagnostic criteria for temporomandibular disorders. The study was approved by the Ethics Committee of Mashhad University of Medical Sciences (IR.MUMS.REC.1392.209). Since the participants were between 20 to 40 years and had no systemic disease, symptoms of osteoporosis, or bone pain, they declined DEXA test. This was the main reason for the small sample size in this study.
1. The American Academy of Orofacial Pain uses capsulitis and synovitis as criteria for TMJ pain [11]. The patients were selected using non-probability sampling based on clinical evaluation by a prosthodontist. The patients had signs of osteoarthritis in both joints. In addition, 20 healthy women with no clinical or radiographic signs/symptoms of TMDs who referred for other dental problems were also included as healthy controls. All participants took part in the study after signing informed consent forms.
CBCT images of the TMJ of both sides were obtained using Planmeca ProMax 3D CBCT scanner (Planmeca, Helsinki, Finland) with 8-bit grayscales and a voxel size of 0.16 mm at the Department of Oral and Maxillofacial Radiology, Faculty of Dentistry of Mashhad University of Medical Sciences. The images were taken with the mouth and teeth closed in maximum intercuspation.
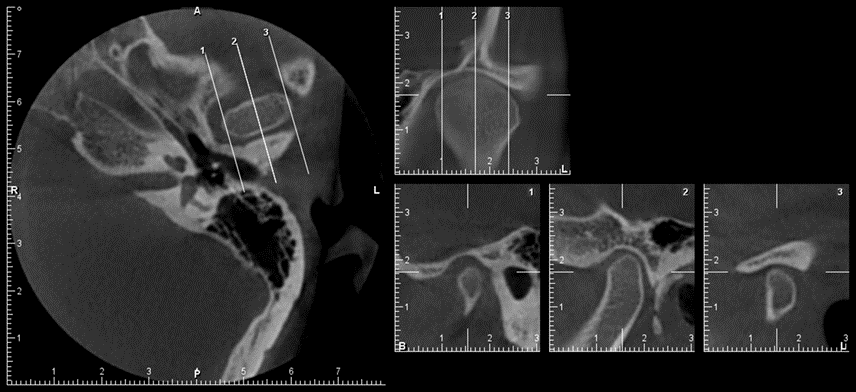
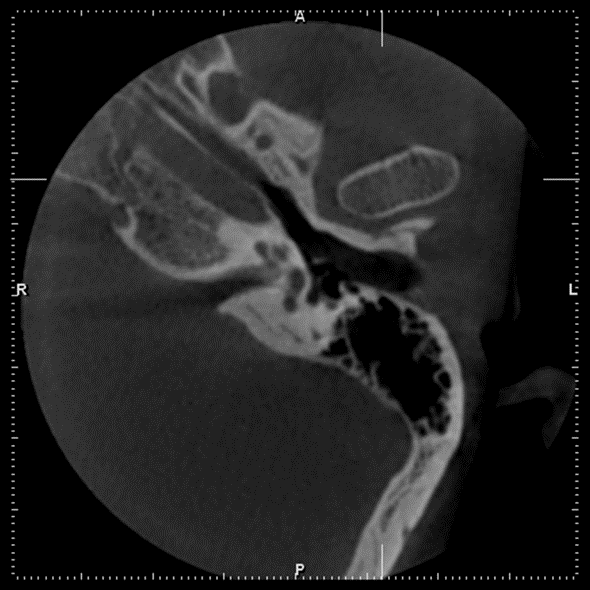
The coronal, sagittal, and axial sections were reconstructed from the 3D images of the TMJ. The sagittal, coronal and axial lines were drawn at the center of the condyles and a section with the largest extent (in millimeters) in the axial plane was selected, and the cross-sectional slice thickness was adjusted. In the coronal and sagittal planes, three images including the anterior border of the condyle, the central sagittal slice, and the posterior border of the condyle were obtained, and the central coronal section was saved (Figs. 1-3).
Fig. 1. Image reconstruction in sagittal plane using Romexis software
Fig. 2. Image reconstruction in coronal plane using Romexis software
Fig. 3. Image reconstruction in axial plane using Romexis software
Calculation of FD:
The simplest and most widely used method for calculating the FD, i.e. box counting, was applied. This technique employs Image J 1.47v software developed by the United States National Institute of Health for medical imaging (can be downloaded from http://imagej.nih.gov/ij) [10]. In the first phase, the region of interest had to be determined in order to calculate the FD. To standardize all images, a circle was drawn to have the highest diameter without affecting the cortical bone margins of the condylar head.
After the images were duplicated, image processing was performed using Analyze > Tools > Fractal Box Count according to the method described by White and Rudolph [11].
The sigma factor was determined to be 5, and in the box counting menu, the size of the grids was determined to be 2, 3, 4, 6, 8, 12, 16, 32, and 64. In the resulting diagram, D represents the FD [11].
Calculation of lacunarity:
After installing the FracLac plugin of Image J software, lacunarity was calculated. The binary images obtained during FD calculation were used for this purpose. The FD and lacunarity of each condyle were calculated as the mean of FDs and lacunarities in the three aforementioned planes.
Bone densitometry (DEXA):
The BMD of each patient was measured at two sites, namely the left femoral neck and the L2-L4 vertebrae using an Osteocore (France) with a maximum voltage of 86 kVp and 1 mA current at 1 µg/scan/h. All phases of the selection of X-ray settings were carried out by the software according to age, gender, and body mass index of patients. At each BMD assessment site, the T-score and Z-score were determined by the software. The T-score is the standard deviation of patient’s BMD from the mean value of a healthy 30-year-old individual of the same sex and race. According to the T-score of each site, patients were classified as normal (T-score≥−1), osteopenic (−2.5
Statistical analysis:
The data were analyzed in PASW Statistics for Windows, version 18.0 (SPSS Inc., Chicago, IL, USA) using t-test, Chi-square test, and Pearson’s correlation coefficient. The Kolmogorov-Smirnov test was used to evaluate the distribution of age, BMD, FD, and lacunarity. BMD comparison between the two groups of controls and osteoarthritis patients was conducted using independent t-test, and evaluation of the independence of qualitative variables (skeletal status of the spine and hip, and TMJ osteoarthritis status) was conducted using the Chi-square test. The Pearson’s correlation coefficient was used to assess the correlations between FD and lacunarity of the two condyles and total hip and spine BMDs. The significance level was set at 0.05.
Results
A total of 39 women aged 20 to 40 years who did not have any systemic disease were included in this study. The mean age was 32.66 ± 6.20 years. A total of 20 healthy individuals with no signs/symptoms of TMJOA and a mean age of 32.20 ± 6.43 years, and 19 TMJOA patients with a mean age of 33.15 ± 6.08 who experienced pain on clinical examination and had skeletal changes in TMJ on radiographs were evaluated.
Considering the normal age distribution in both groups, which was confirmed by the Kolmogorov-Smirnov test (P=0.80 for healthy controls and P=0.73 for TMJOA group), independent t-test was used to compare the groups in terms of the mean age. The results showed no significant difference (P=0.63).
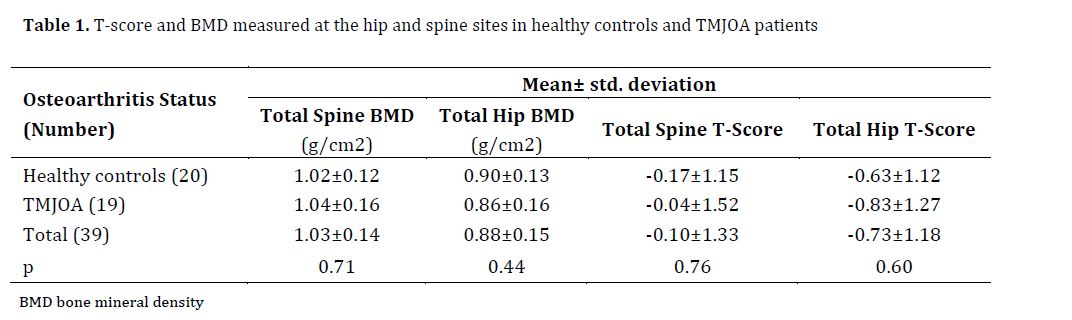
Table 1 presents the mean BMD of total spine and hip as well as their T-scores. According to independent t-test, the mean BMD of total spine (P=0.71) and hip (P=0.44) did not differ significantly in the two groups of controls and TMJOA patients. T-score is the main index for assessing BMD; independent t-test showed no significant difference in the mean T-scores of the hip and spine between healthy controls and TMJOA patients (P>0.05).
In order to increase the accuracy of the assessments of FD and lacunarity, the mean values for the axial, coronal and sagittal planes of the condyle at each side were calculated. This was done for the purpose of standardization and to obtain more homogenous results.
The results showed a significant difference in the mean FD of the right and left sides of the TMJ (P=0.003), and no significant difference in lacunarity of the right and left condyles (P=0.23).
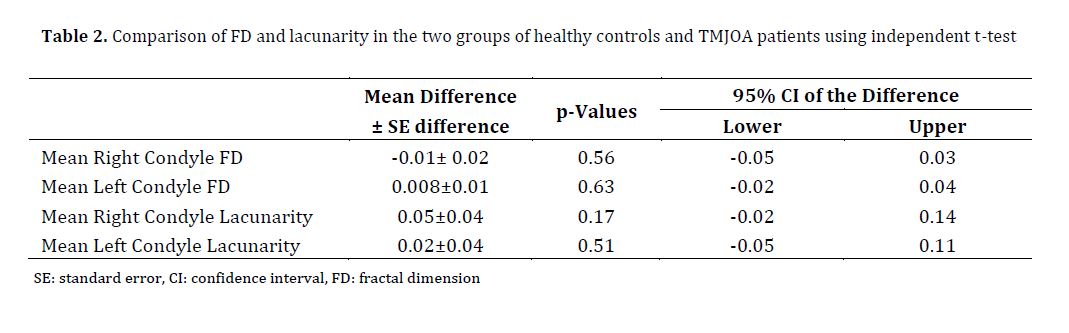
In view of the normal distribution of FD and lacunarity, independent t-test was used to compare the mean values of healthy controls and osteoarthritis patients. The results showed no significant difference between the two groups in any of the variables (P>0.05, Table 2).
Considering the normal distribution of FD and lacunarity of the two condyles and the normal distribution of total hip and spine BMDs, the Pearson’s correlation coefficient was used to assess the correlations. The Pearson’s correlation coefficients showed significant correlation between the mean lacunarity of the right and left condyles (P=0.003 and r=0.47), and total hip and spine BMDs (P=0.01, r=0.40).
A cross tabulation was done to assess the correlation between the two qualitative variables of spine BMD and TMJOA Discussion
Osteoporosis has a wide variety of complications, and its early detection can prevent many complications such as hip fracture. Therefore, it is important to find efficient screening tools for the entire population. Since the techniques available for this purpose are difficult to apply in the maxillofacial region, it is imperative to find a method for assessing skeletal status using conventional dental radiography [1,3].
This study aimed to assess BMD in women and its correlation with fractal analysis of the condyles using CBCT. There has been no similar study on the Iranian population, and no information on FD and lacunarity based on CBCT images of the mandibular condyle. Moreover, to the best of our knowledge, this study is the first to apply three planes, i.e. axial, coronal, and sagittal to calculate the mean FD and lacunarity of the condyle. The results showed that the BMD of the vertebrae and hip did not differ significantly in the two groups of patients with TMJOA and healthy controls. Similar to our study, Estrugo-Devesa et al. [13] found no correlation between mandibular and femoral neck densitometry. Significant correlations were found, however, between densitometry results for the lumbar spine and mandible. On the other hand, Esfahanizadeh et al. [14] reported that osteoporosis and osteopenia of the maxilla and mandible may reflect a similar status in other bones. While we examined the condyles, they assessed the ramus and the body of mandible as well as the anterior part of the maxilla and mandible.
Some studies showed that the BMD of patients with osteoarthritis of the knee, hip, and hand was significantly higher than that of controls [15,16]. The reason for the higher incidence of osteoarthritis in these joints is the initially high BMD in these individuals, which would cause greater pressure on the joints [16]. Haugen et al. [17] examined patients with osteoarthritis of the hand and discussed that higher BMD compared to controls was due to the higher number of patients on estrogen replacement therapy. They assessed the correlation between BMD and TMJOA. The discrepancies in the results can be explained by noting the fact that, unlike knees, hip and feet, the TMJ does not tolerate body weight, and thus, the baseline BMD does not play a role in the course of disease. In addition, the patients in our study were not under systemic estrogen replacement therapy as in the study by Haugen et al [17]. Therefore, the reasons suggested for higher BMD in patients with osteoarthritis of other joints played no role in our results.
In our study, the results for fractal analysis and lacunarity of trabecular bone of the condylar head showed no significant difference between healthy controls and TMJOA patients. By increasing the loads exerted to the condylar cartilage, Kaul et al. [18] noted a significant increase in bone volume and trabecular thickness. The space between subchondral trabeculae also decreased. Chen et al. [19] reported significant changes in subchondral bone 9 months after induction of osteoarthritis in rats. They showed that trabecular thickness significantly decreased in TMJOA, and the trabecular space significantly increased [18]. Such an inconsistency may be due to the fact that Chen et al. [19] examined the trabecular bone adhered to the cortex of the condylar head, while we examined the central part of the condylar head.
The patients in the present study were between 20 to 40 years. No significant difference was observed in the mean age of TMJOA patients and healthy controls.
However, Chen et al. [19] found that skeletal changes occurred 6 months after the cartilage changes. Thus, a time lapse not only leads to osteoarthritis, but can also affect skeletal changes. According to Cevidanes et al, [20] resorptive changes and pain intensity and duration also increased.
Ganguly et al. [21] showed that older age caused functional defects at the cellular level through a complex process of accumulation of injury, so that the senescent cells increased and their resistance to oxidative stress decreased. Therefore, the time passed since the onset of osteoarthritis can serve as a confounding factor. It is also possible that patients in later stages of the disease experience skeletal changes at the center of condyles. To prevent the effect of this confounder, future studies should categorize osteoarthritis patients according to the severity of their condition, which would indicate the time lapse since the onset of disease.
Considering the hormonal changes that occur in postmenopausal women, progesterone levels and development of osteoporosis may explain higher rate of TMJ problems in women. Therefore, only women with normal menstrual status were examined in the present study. Tonin et al. [22] concluded that the prevalence of TMJ problems was higher in women, probably due to female hormones that alter the pain threshold.
In the present study, similar to studies by Moayyeri et al, [23] and Haugen et al, [17] the BMD of the lumbar vertebrae and hip was measured using DEXA. In the study by Moayyeri et al, [23] the BMD and T-score of the hip and lumbar vertebrae were correlated. Similarly, we observed a significant correlation between the BMD and T-score of the hip and lumbar vertebrae.
However, Gaalaas et al. [24] reported that the BMD of more than half of the patients measured by DEXA did not correlate with the T-scores of their hip and lumbar vertebrae. Such an inconsistency could be due to physiological and pathological factors, as well as the function of DEXA.
In the present study, the coronal, sagittal and axial sections were selected for fractal analysis and measuring the lacunarity of the middle part of the condyles, and the mean of the results of the three analyses was calculated. Similar to the present study, Gaalaas et al. [24] used the middle part of the condylar head for fractal analysis and similarly selected the region of interest so that the cortical bone was not included in the analysis. However, they only analyzed the data from the coronal sections. It appears that evaluating all three dimensions and calculating the mean would allow a more accurate estimate of the trabeculae.
In the present study, a fractal analysis was carried out on CBCT images. CBCT has high dimensional accuracy and offers a spatial resolution of less than 1 mm. High diagnostic quality with a short scanning time (10-70 seconds) and a significantly lower radiation dose compared with CT are some of the advantages of CBCT. Moreover, CBCT enables the assessment of all three planes and visualizes bone details better by eliminating overlays compared with conventional radiography. Similar to the present study, Gaalaas et al. [24] and Ling et al. [2] used CBCT for fractal analysis of different parts of the maxilla and mandible.
In a study by Yamada et al, [25] there was a correlation between the bone density of the lumbar spine (L1–L3) and that of mandibular condyle, both of which decreased in a similar way with age. Their data were obtained using quantitative CT. However, Alkhader et al. [26] used CBCT and recommended measuring the bone density of mandibular condyle instead of mental index when the mandible is not visible on images for any reason [26].
Although, unlike this study, the aforementioned two studies did not use DEXA, they supported the idea that the mineral density of mandibular condyle can be used to predict the risk of osteoporosis in patients. In contrast to our study, Gumussoy et al. [27] found a correlation between the severity of degenerative joint disorder of the TMJ on CBCT images and FD. They showed that the mean FD was higher in mild erosive osteoarthritic change in healthy controls, and that it was the lowest in severe erosive osteoarthritic change. The differences were statistically significant. Compared to our study, they used a larger sample size and different age range, and included both genders. Also, Kayipmaz et al. [8] reported a larger FD in healthy controls than in patients with TMJOA (1.23 versus 1.18, P=0.003). Different age range (21-57 years) and ethnicity justify the inconsistency between their results and the present findings. Therefore, CBCT can serve as an accurate technique with sufficient sensitivity to detect skeletal changes.
Further studies are required to demonstrate the CBCT’s capabilities as a screening tool for skeletal problems.
Conclusion
The mean BMD of total spine and hip did not differ significantly in the two groups of healthy controls and TMJOA patients. The FD and lacunarity showed no significant difference in the two groups either.
The coronal, sagittal, and axial sections were reconstructed from the 3D images of the TMJ. The sagittal, coronal and axial lines were drawn at the center of the condyles and a section with the largest extent (in millimeters) in the axial plane was selected, and the cross-sectional slice thickness was adjusted. In the coronal and sagittal planes, three images including the anterior border of the condyle, the central sagittal slice, and the posterior border of the condyle were obtained, and the central coronal section was saved (Figs. 1-3).
Fig. 1. Image reconstruction in sagittal plane using Romexis software
Fig. 2. Image reconstruction in coronal plane using Romexis software
Fig. 3. Image reconstruction in axial plane using Romexis software
Calculation of FD:
The simplest and most widely used method for calculating the FD, i.e. box counting, was applied. This technique employs Image J 1.47v software developed by the United States National Institute of Health for medical imaging (can be downloaded from http://imagej.nih.gov/ij) [10]. In the first phase, the region of interest had to be determined in order to calculate the FD. To standardize all images, a circle was drawn to have the highest diameter without affecting the cortical bone margins of the condylar head.
After the images were duplicated, image processing was performed using Analyze > Tools > Fractal Box Count according to the method described by White and Rudolph [11].
The sigma factor was determined to be 5, and in the box counting menu, the size of the grids was determined to be 2, 3, 4, 6, 8, 12, 16, 32, and 64. In the resulting diagram, D represents the FD [11].
Calculation of lacunarity:
After installing the FracLac plugin of Image J software, lacunarity was calculated. The binary images obtained during FD calculation were used for this purpose. The FD and lacunarity of each condyle were calculated as the mean of FDs and lacunarities in the three aforementioned planes.
Bone densitometry (DEXA):
The BMD of each patient was measured at two sites, namely the left femoral neck and the L2-L4 vertebrae using an Osteocore (France) with a maximum voltage of 86 kVp and 1 mA current at 1 µg/scan/h. All phases of the selection of X-ray settings were carried out by the software according to age, gender, and body mass index of patients. At each BMD assessment site, the T-score and Z-score were determined by the software. The T-score is the standard deviation of patient’s BMD from the mean value of a healthy 30-year-old individual of the same sex and race. According to the T-score of each site, patients were classified as normal (T-score≥−1), osteopenic (−2.5
Statistical analysis:
The data were analyzed in PASW Statistics for Windows, version 18.0 (SPSS Inc., Chicago, IL, USA) using t-test, Chi-square test, and Pearson’s correlation coefficient. The Kolmogorov-Smirnov test was used to evaluate the distribution of age, BMD, FD, and lacunarity. BMD comparison between the two groups of controls and osteoarthritis patients was conducted using independent t-test, and evaluation of the independence of qualitative variables (skeletal status of the spine and hip, and TMJ osteoarthritis status) was conducted using the Chi-square test. The Pearson’s correlation coefficient was used to assess the correlations between FD and lacunarity of the two condyles and total hip and spine BMDs. The significance level was set at 0.05.
Results
A total of 39 women aged 20 to 40 years who did not have any systemic disease were included in this study. The mean age was 32.66 ± 6.20 years. A total of 20 healthy individuals with no signs/symptoms of TMJOA and a mean age of 32.20 ± 6.43 years, and 19 TMJOA patients with a mean age of 33.15 ± 6.08 who experienced pain on clinical examination and had skeletal changes in TMJ on radiographs were evaluated.
Considering the normal age distribution in both groups, which was confirmed by the Kolmogorov-Smirnov test (P=0.80 for healthy controls and P=0.73 for TMJOA group), independent t-test was used to compare the groups in terms of the mean age. The results showed no significant difference (P=0.63).
Table 1 presents the mean BMD of total spine and hip as well as their T-scores. According to independent t-test, the mean BMD of total spine (P=0.71) and hip (P=0.44) did not differ significantly in the two groups of controls and TMJOA patients. T-score is the main index for assessing BMD; independent t-test showed no significant difference in the mean T-scores of the hip and spine between healthy controls and TMJOA patients (P>0.05).
In order to increase the accuracy of the assessments of FD and lacunarity, the mean values for the axial, coronal and sagittal planes of the condyle at each side were calculated. This was done for the purpose of standardization and to obtain more homogenous results.
The results showed a significant difference in the mean FD of the right and left sides of the TMJ (P=0.003), and no significant difference in lacunarity of the right and left condyles (P=0.23).
In view of the normal distribution of FD and lacunarity, independent t-test was used to compare the mean values of healthy controls and osteoarthritis patients. The results showed no significant difference between the two groups in any of the variables (P>0.05, Table 2).
Considering the normal distribution of FD and lacunarity of the two condyles and the normal distribution of total hip and spine BMDs, the Pearson’s correlation coefficient was used to assess the correlations. The Pearson’s correlation coefficients showed significant correlation between the mean lacunarity of the right and left condyles (P=0.003 and r=0.47), and total hip and spine BMDs (P=0.01, r=0.40).
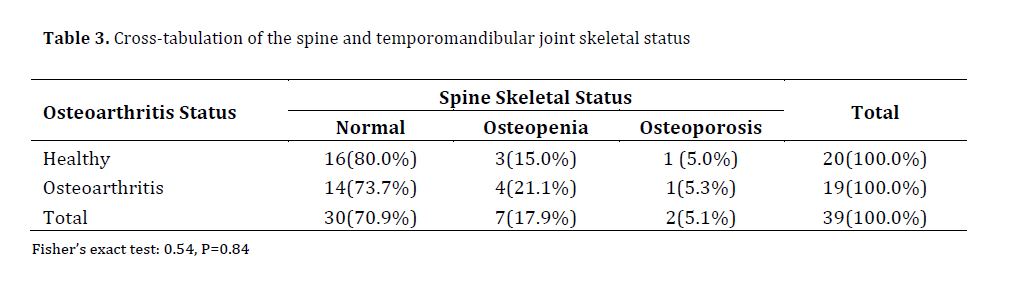
A cross tabulation was done to assess the correlation between the two qualitative variables of spine BMD and TMJOA Discussion
Osteoporosis has a wide variety of complications, and its early detection can prevent many complications such as hip fracture. Therefore, it is important to find efficient screening tools for the entire population. Since the techniques available for this purpose are difficult to apply in the maxillofacial region, it is imperative to find a method for assessing skeletal status using conventional dental radiography [1,3].
This study aimed to assess BMD in women and its correlation with fractal analysis of the condyles using CBCT. There has been no similar study on the Iranian population, and no information on FD and lacunarity based on CBCT images of the mandibular condyle. Moreover, to the best of our knowledge, this study is the first to apply three planes, i.e. axial, coronal, and sagittal to calculate the mean FD and lacunarity of the condyle. The results showed that the BMD of the vertebrae and hip did not differ significantly in the two groups of patients with TMJOA and healthy controls. Similar to our study, Estrugo-Devesa et al. [13] found no correlation between mandibular and femoral neck densitometry. Significant correlations were found, however, between densitometry results for the lumbar spine and mandible. On the other hand, Esfahanizadeh et al. [14] reported that osteoporosis and osteopenia of the maxilla and mandible may reflect a similar status in other bones. While we examined the condyles, they assessed the ramus and the body of mandible as well as the anterior part of the maxilla and mandible.
Some studies showed that the BMD of patients with osteoarthritis of the knee, hip, and hand was significantly higher than that of controls [15,16]. The reason for the higher incidence of osteoarthritis in these joints is the initially high BMD in these individuals, which would cause greater pressure on the joints [16]. Haugen et al. [17] examined patients with osteoarthritis of the hand and discussed that higher BMD compared to controls was due to the higher number of patients on estrogen replacement therapy. They assessed the correlation between BMD and TMJOA. The discrepancies in the results can be explained by noting the fact that, unlike knees, hip and feet, the TMJ does not tolerate body weight, and thus, the baseline BMD does not play a role in the course of disease. In addition, the patients in our study were not under systemic estrogen replacement therapy as in the study by Haugen et al [17]. Therefore, the reasons suggested for higher BMD in patients with osteoarthritis of other joints played no role in our results.
In our study, the results for fractal analysis and lacunarity of trabecular bone of the condylar head showed no significant difference between healthy controls and TMJOA patients. By increasing the loads exerted to the condylar cartilage, Kaul et al. [18] noted a significant increase in bone volume and trabecular thickness. The space between subchondral trabeculae also decreased. Chen et al. [19] reported significant changes in subchondral bone 9 months after induction of osteoarthritis in rats. They showed that trabecular thickness significantly decreased in TMJOA, and the trabecular space significantly increased [18]. Such an inconsistency may be due to the fact that Chen et al. [19] examined the trabecular bone adhered to the cortex of the condylar head, while we examined the central part of the condylar head.
The patients in the present study were between 20 to 40 years. No significant difference was observed in the mean age of TMJOA patients and healthy controls.
However, Chen et al. [19] found that skeletal changes occurred 6 months after the cartilage changes. Thus, a time lapse not only leads to osteoarthritis, but can also affect skeletal changes. According to Cevidanes et al, [20] resorptive changes and pain intensity and duration also increased.
Ganguly et al. [21] showed that older age caused functional defects at the cellular level through a complex process of accumulation of injury, so that the senescent cells increased and their resistance to oxidative stress decreased. Therefore, the time passed since the onset of osteoarthritis can serve as a confounding factor. It is also possible that patients in later stages of the disease experience skeletal changes at the center of condyles. To prevent the effect of this confounder, future studies should categorize osteoarthritis patients according to the severity of their condition, which would indicate the time lapse since the onset of disease.
Considering the hormonal changes that occur in postmenopausal women, progesterone levels and development of osteoporosis may explain higher rate of TMJ problems in women. Therefore, only women with normal menstrual status were examined in the present study. Tonin et al. [22] concluded that the prevalence of TMJ problems was higher in women, probably due to female hormones that alter the pain threshold.
In the present study, similar to studies by Moayyeri et al, [23] and Haugen et al, [17] the BMD of the lumbar vertebrae and hip was measured using DEXA. In the study by Moayyeri et al, [23] the BMD and T-score of the hip and lumbar vertebrae were correlated. Similarly, we observed a significant correlation between the BMD and T-score of the hip and lumbar vertebrae.
However, Gaalaas et al. [24] reported that the BMD of more than half of the patients measured by DEXA did not correlate with the T-scores of their hip and lumbar vertebrae. Such an inconsistency could be due to physiological and pathological factors, as well as the function of DEXA.
In the present study, the coronal, sagittal and axial sections were selected for fractal analysis and measuring the lacunarity of the middle part of the condyles, and the mean of the results of the three analyses was calculated. Similar to the present study, Gaalaas et al. [24] used the middle part of the condylar head for fractal analysis and similarly selected the region of interest so that the cortical bone was not included in the analysis. However, they only analyzed the data from the coronal sections. It appears that evaluating all three dimensions and calculating the mean would allow a more accurate estimate of the trabeculae.
In the present study, a fractal analysis was carried out on CBCT images. CBCT has high dimensional accuracy and offers a spatial resolution of less than 1 mm. High diagnostic quality with a short scanning time (10-70 seconds) and a significantly lower radiation dose compared with CT are some of the advantages of CBCT. Moreover, CBCT enables the assessment of all three planes and visualizes bone details better by eliminating overlays compared with conventional radiography. Similar to the present study, Gaalaas et al. [24] and Ling et al. [2] used CBCT for fractal analysis of different parts of the maxilla and mandible.
In a study by Yamada et al, [25] there was a correlation between the bone density of the lumbar spine (L1–L3) and that of mandibular condyle, both of which decreased in a similar way with age. Their data were obtained using quantitative CT. However, Alkhader et al. [26] used CBCT and recommended measuring the bone density of mandibular condyle instead of mental index when the mandible is not visible on images for any reason [26].
Although, unlike this study, the aforementioned two studies did not use DEXA, they supported the idea that the mineral density of mandibular condyle can be used to predict the risk of osteoporosis in patients. In contrast to our study, Gumussoy et al. [27] found a correlation between the severity of degenerative joint disorder of the TMJ on CBCT images and FD. They showed that the mean FD was higher in mild erosive osteoarthritic change in healthy controls, and that it was the lowest in severe erosive osteoarthritic change. The differences were statistically significant. Compared to our study, they used a larger sample size and different age range, and included both genders. Also, Kayipmaz et al. [8] reported a larger FD in healthy controls than in patients with TMJOA (1.23 versus 1.18, P=0.003). Different age range (21-57 years) and ethnicity justify the inconsistency between their results and the present findings. Therefore, CBCT can serve as an accurate technique with sufficient sensitivity to detect skeletal changes.
Further studies are required to demonstrate the CBCT’s capabilities as a screening tool for skeletal problems.
Conclusion
The mean BMD of total spine and hip did not differ significantly in the two groups of healthy controls and TMJOA patients. The FD and lacunarity showed no significant difference in the two groups either.
Type of Study: Original article |
Subject:
Radiology
References
1. Cakur B, Dagistan S, Sahin A, Harorli A, Yilmaz A. Reliability of mandibular cortical index and mandibular bone mineral density in the detection of osteoporotic women. Dentomaxillofac Radiol. 2009 Jul;38(5):255-61. [DOI:10.1259/dmfr/22559806] [PMID]
2. Ling H, Yang X, Li P, Megalooikonomou V, Xu Y, Yang J. Cross gender-age trabecular texture analysis in cone beam CT. Dentomaxillofac Radiol. 2014;43(4):20130324. [DOI:10.1259/dmfr.20130324] [PMID] [PMCID]
3. Winzenberg T, Jones G. Dual energy X-ray absorptiometry. Aust Fam Physician. 2011 Jan-Feb;40(1-2):43-4.
4. Lee DH, Ku Y, Rhyu IC, Hong JU, Lee CW, Heo MS, Huh KH. A clinical study of alveolar bone quality using the fractal dimension and the implant stability quotient. J Periodontal Implant Sci. 2010 Feb;40(1):19-24. [DOI:10.5051/jpis.2010.40.1.19] [PMID] [PMCID]
5. Toghyani S, Nasseh I, Aoun G, Noujeim M. Effect of Image Resolution and Compression on Fractal Analysis of the Periapical Bone. Acta Inform Med. 2019 Sep;27(3):167-70. [DOI:10.5455/aim.2019.27.167-170] [PMID] [PMCID]
6. Geraets WG, Verheij JG, van der Stelt PF, Horner K, Lindh C, Nicopoulou-Karayianni K, Jacobs R, Harrison EJ, Adams JE, Devlin H. Prediction of bone mineral density with dental radiographs. Bone. 2007 May;40(5):1217-21. [DOI:10.1016/j.bone.2007.01.009] [PMID]
7. Hua Y, Nackaerts O, Duyck J, Maes F, Jacobs R. Bone quality assessment based on cone beam computed tomography imaging. Clin Oral Implants Res. 2009 Aug;20(8):767-71. [DOI:10.1111/j.1600-0501.2008.01677.x] [PMID]
8. Kayipmaz S, Akçay S, Sezgin ÖS, Çandirli C. Trabecular structural changes in the mandibular condyle caused by degenerative osteoarthritis: a comparative study by cone-beam computed tomography imaging. Oral Radiol. 2019 Jan;35(1):51-8. [DOI:10.1007/s11282-018-0324-1] [PMID]
9. Sánchez I, Uzcátegui G. Fractals in dentistry. J Dent. 2011 Apr;39(4):273-92. [DOI:10.1016/j.jdent.2011.01.010] [PMID]
10. Schneider CA, Rasband WS, Eliceiri KW. NIH Image to ImageJ: 25 years of image analysis. Nat Methods. 2012 Jul;9(7):671-5. [DOI:10.1038/nmeth.2089] [PMID] [PMCID]
11. White SC, Rudolph DJ. Alterations of the trabecular pattern of the jaws in patients with osteoporosis. Oral Surg Oral Med Oral Pathol Oral Radiol Endod. 1999 Nov;88(5): 628-35. [DOI:10.1016/S1079-2104(99)70097-1]
12. Binkovitz LA, Henwood MJ, Sparke P. Pediatric DXA: technique, interpretation and clinical applications. Pediatr Radiol. 2008 May;38 Suppl 2:S227-39. [DOI:10.1007/s00247-008-0808-y] [PMID]
13. Estrugo-Devesa A, Segura-Egea J, García-Vicente L, Schemel-Suárez M, Blanco-Carrrión Á, Jané-Salas E, López-López J. Correlation between mandibular bone density and skeletal bone density in a Catalonian postmenopausal population. Oral Surg Oral Med Oral Pathol Oral Radiol. 2018 May;125(5):495-502. [DOI:10.1016/j.oooo.2017.10.003] [PMID]
14. Esfahanizadeh N, Davaie S, Rokn AR, Daneshparvar HR, Bayat N, Khondi N, Ajvadi S, Ghandi M. Correlation between bone mineral density of jaws and skeletal sites in an Iranian population using dual X-ray energy absorptiometry. Dent Res J (Isfahan). 2013 Jul;10(4):460-6.
15. Povoroznyuk VV, Zaverukha NV, Musiienko AS. Bone mineral density and trabecular bone score in post-menopausal women with knee osteoarthritis and obesity. Wiad Lek. 2020;73(3):529-33. [DOI:10.36740/WLek202003124] [PMID]
16. Pham D, Jonasson G, Kiliaridis S. Assessment of trabecular pattern on periapical and panoramic radiographs: a pilot study. Acta Odontol Scand. 2010 Mar;68(2):91-7. [DOI:10.3109/00016350903468235] [PMID]
17. Haugen IK, Slatkowsky-Christensen B, Orstavik R, Kvien TK. Bone mineral density in patients with hand osteoarthritis compared to population controls and patients with rheumatoid arthritis. Ann Rheum Dis. 2007 Dec;66 (12):1594-8. [DOI:10.1136/ard.2006.068940] [PMID] [PMCID]
18. Kaul R, O'Brien MH, Dutra E, Lima A, Utreja A, Yadav S. The Effect of Altered Loading on Mandibular Condylar Cartilage. PLoS One. 2016 Jul 29;11(7):e0160121. [DOI:10.1371/journal.pone.0160121] [PMID] [PMCID]
19. Chen J, Gupta T, Barasz JA, Kalajzic Z, Yeh WC, Drissi H, Hand AR, Wadhwa S. Analysis of microarchitectural changes in a mouse temporomandibular joint osteoarthritis model. Arch Oral Biol. 2009 Dec;54(12):1091-8. [DOI:10.1016/j.archoralbio.2009.10.001] [PMID] [PMCID]
20. Cevidanes LH, Hajati AK, Paniagua B, Lim PF, Walker DG, Palconet G, Nackley AG, Styner M, Ludlow JB, Zhu H, Phillips C. Quantification of condylar resorption in temporomandibular joint osteoarthritis. Oral Surg Oral Med Oral Pathol Oral Radiol Endod. 2010 Jul;110(1):110-7. [DOI:10.1016/j.tripleo.2010.01.008] [PMID] [PMCID]
21. Ganguly P, El-Jawhari JJ, Giannoudis PV, Burska AN, Ponchel F, Jones EA. Age-related Changes in Bone Marrow Mesenchymal Stromal Cells: A Potential Impact on Osteoporosis and Osteoarthritis Development. Cell Transplant. 2017 Sep;26(9):1520-9. [DOI:10.1177/0963689717721201] [PMID] [PMCID]
22. Tonin RH, Iwaki Filho L, Grossmann E, Lazarin RO, Pinto GNS, Previdelli ITS, Iwaki LCV. Correlation between age, gender, and the number of diagnoses of temporomandibular disorders through magnetic resonance imaging: A retrospective observational study. Cranio. 2020 Jan;38(1): 34-42. [DOI:10.1080/08869634.2018.1476078] [PMID]
23. Moayyeri A, Soltani A, Khaleghnejad Tabari N, Sadatsafavi M, Hossein-Neghad A, Larijani B. Discordance in diagnosis of osteoporosis using spine and hip bone densitometry. BMC Endocr Disord. 2005;5(3):1-6. [DOI:10.1186/1472-6823-5-3] [PMID] [PMCID]
24. Gaalaas L, Henn L, Gaillard PR, Ahmad M, Islam MS. Analysis of trabecular bone using site-specific fractal values calculated from cone beam CT images. Oral Radiol. 2014; 30 (2):179-85. [DOI:10.1007/s11282-013-0163-z]
25. Yamada M, Ito M, Hayashi K, Sato H, Nakamura T. Mandibular condyle bone mineral density measurement by quantitative computed tomography: a gender-related difference in correlation to spinal bone mineral density. Bone. 1997 Nov;21(5):441-5. [DOI:10.1016/S8756-3282(97)00171-3]
26. Alkhader M, Aldawoodyeh A, Abdo N. Usefulness of measuring bone density of mandibular condyle in patients at risk of osteoporosis: A cone beam computed tomography study. Eur J Dent. 2018 Jul-Sep;12(3):363-8. [DOI:10.4103/ejd.ejd_272_17] [PMID] [PMCID]
27. Gumussoy I, Duman SB. Alternative cone-beam CT method for the analysis of mandibular condylar bone in patients with degenerative joint disease. Oral Radiol. 2020 Apr;36(2):177-82. [DOI:10.1007/s11282-019-00395-0] [PMID]
Send email to the article author
| Rights and permissions | |
 |
This work is licensed under a Creative Commons Attribution-NonCommercial 4.0 International License. |