

BibTeX | RIS | EndNote | Medlars | ProCite | Reference Manager | RefWorks
Send citation to:
URL: http://jrdms.dentaliau.ac.ir/article-1-261-en.html


2- Professor,Oral and maxilofacial Radiology Dept ,Tehran Medical Sciences, Islamic Azad University, Tehran, Iran
3- Dentist, Frankfurt, Germany
4- Assistant professor,Oral and maxilofacial Radiology Dept , Faculty of Dentistry,Tehran Medical Sciences
Abstract
Background and Aim: Bone density is of great assistance in the selection of the proper implant site. The present study aimed to assess the correlation between tissue densities in computed tomography (CT) and three different cone-beam computed tomography (CBCT) units.
Materials and Methods: In this descriptive study, a radiographic phantom consisting of a transparent polymethyl methacrylate (PMMA) cylinder with a 50-mm height and a 50-mm diameter was used, which comprised eight materials, including air, fat, water, PMMA, muscle, cortical bone, cancellous bone, and aluminum. Each material was of 5 mm height and 5 mm in diameter. A 20-mm-thick hollow plexiglass cylinder was used to simulate the soft tissue. The phantom was scanned four times using 16-Slice Lightspeed CT, NewTom VGi, CRANEX 3D, and Rotograph Evo 3D CBCT units. The data were primarily reconstructed and transferred to the OnDemand 3D software in the Digital Imaging and Communications in Medicine (DICOM) format. All the assessments were made in the sagittal plane, and the average density of each of the mentioned eight materials was calculated with the proper grayscale value calculation of each system, which utilizes a simulation inherent density calculation for any region of interest (ROI).
Results: The results showed that tissue densities are different in CT and CBCT units. The values estimated by the CRANEX 3D unit approximated that of CT, followed by NewTom VGi and Rotograph Evo 3D CBCT units. Kruskal-Wallis test showed that the differences in the scores are statistically significant (P<0.01),
Conclusion: Considering the results, CBCT cannot accurately calculate tissue density.
Keywords: Bone Density, Cone-Beam Computed Tomography, In Vitro Techniques, Multidetector Computed Tomography, Radiographic Image Interpretation, Computer-Assisted, Software
Introduction
Assessment of the mechanical properties of the implant recipient bone is one of the concerns among dentists, which can significantly affect the osseointegration process and the primary stability of the implant. (1-3) One of the most important assessment indices is bone density, which is of great assistance in the selection of the proper implant site. (4) Armstrong, in 2006, stated that the Hounsfield Unit (HU) and the grayscale of a single point are not equal. (5) Katsumata et al declared that grayscale values obtained by the use of cone-beam computed tomography (CBCT) are reliable. (6) Mah et al stated that the differences between grayscale and HU are insignificant. (7)
During recent years, computed tomography (CT) has been implemented in the assessment of bone quality. (4,6,7) However, CT scan has some disadvantages including limited availability and a high effective dose. (4-8) On the other hand, CBCT has many advantages such as a lower radiation dose, availability, shorter image acquisition time, and sub-millimeter resolution compared to CT. (9-12) However, recent studies have proven that CBCT's effective dose is variable and can be affected by factors such as device type, the field of view (FOV), the number of base projections, and scan mode. (13) Nevertheless, CBCT is the modality of choice for bone assessment before implant placement with approved accuracy of linear measurements and accurate assessment of adjacent anatomy. (14) But disadvantages such as beam hardening artifact, high radiation scatter, and inability to render actual HU values are among the limitations of CBCT. (9,10,15,16) CBCT has the potential to assess bone density, and overall, grayscale can be used for bone density assessment. (17-19) However, the bone density obtained by the grayscale in CBCT has not yet been calibrated to conform to HU in CT; their correlation is indefinite. (20) The present in-vitro study aimed to assess the correlation between tissue densities in CT and three different CBCT units at the Oral and Maxillofacial Radiology Department of the Dental Faculty of Islamic Azad University of Medical Sciences, Tehran, Iran, during 2014-2015.
Materials and Methods
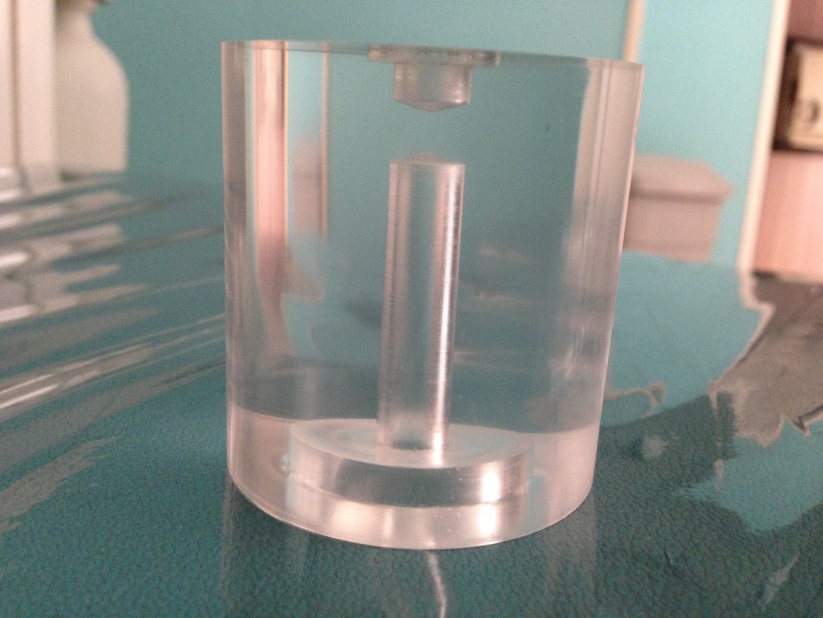
In this experimental study, a radiographic phantom comprised of eight materials, including air, fat, water, polymethyl methacrylate (PMMA), muscle, cortical bone, cancellous bone, and aluminum, was used. (7,11) This phantom consisted of a transparent PMMA cylinder with a 50-mm height and a 50-mm diameter. (7) The materials were located at the center of the phantom's vertical dimension in the following order: air, fat, water, PMMA, muscle, cancellous bone, cortical bone, and aluminum. Each material had a 5-mm height and a 5-mm diameter. An empty cavity with a 5-mm height and a 20-mm diameter was formed at the bottom of the phantom (Figure 1). (7)
Figure 1. The phantom
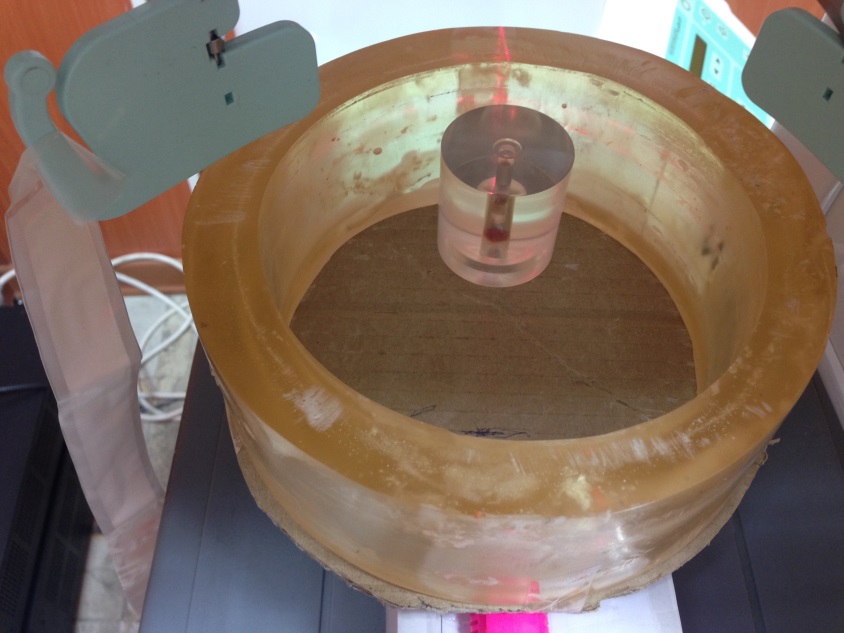
A 20-mm-thick hollow plexiglass cylinder was used to simulate the soft tissue, and the samples were placed at the center of this cylinder (Figure 2). (21)
Figure 2. A 20-mm-thick hollow plexiglass cylinder
was used to simulate the soft tissue
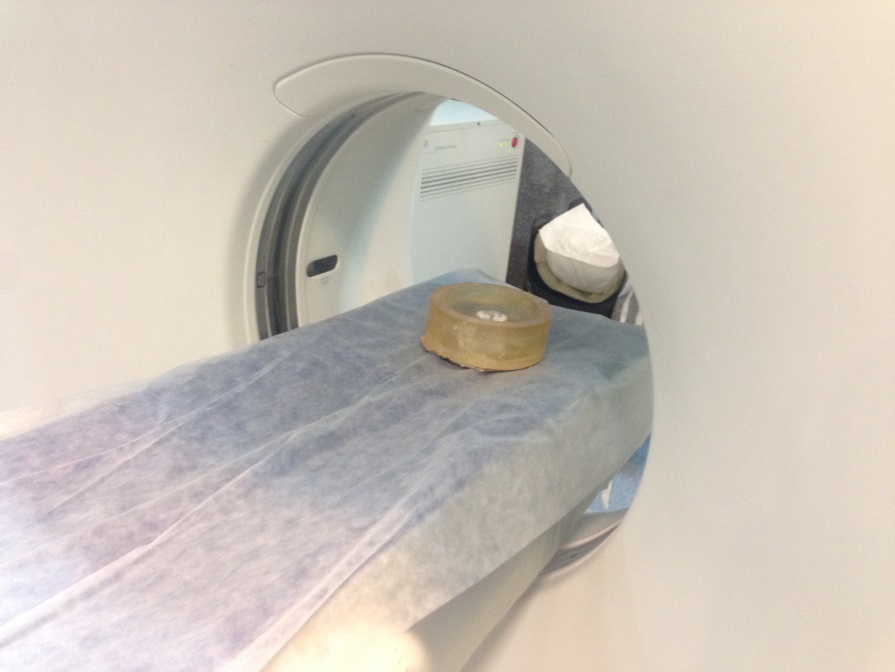
The CT unit in the present study was 16-slice Lightspeed CT (GE Medical Systems, USA). The CBCT units were NewTom VGi (Verona, Italy; CBCT1), CRANEX 3D (Soredex, Helsinki, Finland; CBCT2), and Rotograph Evo 3D (Villa, Italy; CBCT3). The phantom was placed at the center of the FOV, and scout images were obtained to ensure proper adjustment (Figure 3). (7) The obtained data were primarily reconstructed by the software provided by the manufacturing company of each scanner and were transferred in the Digital Imaging and Communications in Medicine (DICOM) format to third-party software for analysis. (7) Softwares for primary reconstruction included: ADM software for 16-slice Lightspeed CT, NNT software for CBCT1, OnDemand Software for CBCT2, and Dental Studio Plus software for CBCT3.
Figure 3. The phantom was placed at the center of the field of view (FOV), and scout images were obtained to ensure proper adjustment
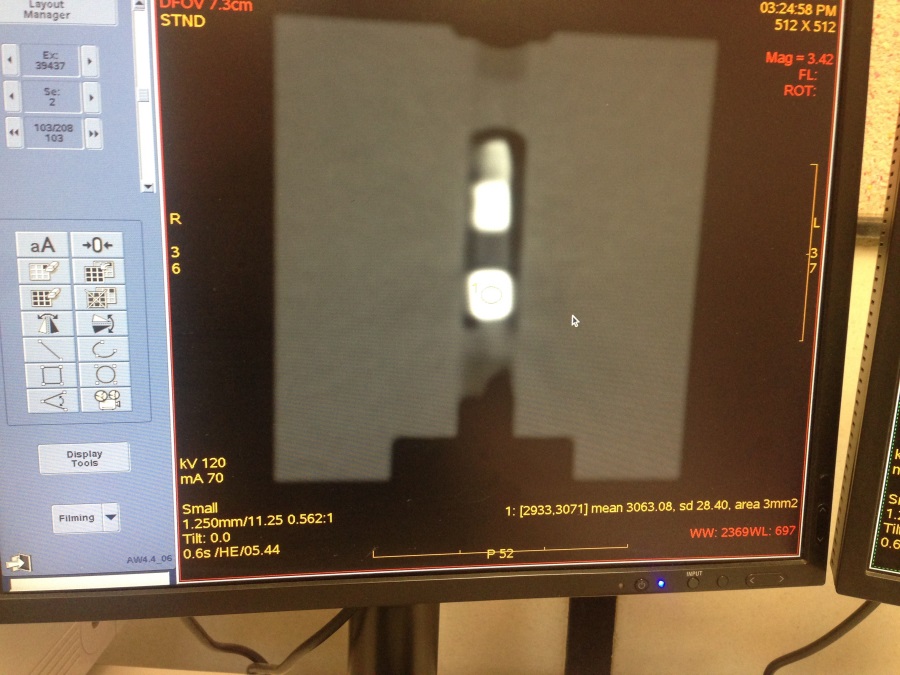
The DICOM data analysis was performed by the OnDemand software (CyberMed International, Seoul, Korea) in the three-dimensional (3D) mode. (7) All the assessments were made in the sagittal plane, and the average density of each of the mentioned eight materials was calculated. The grayscale value calculation of each system was performed with the utilization of a simulation of inherent density calculation for any region of interest (ROI). The images of each scan were captured by the image capture function of the OnDemand 3D software and were saved using the Microsoft Word Document software (Figure 4). (7)
Figure 4. The images of each scan were captured by the image capture function of the OnDemand 3D software (CyberMed International, Seoul, Korea )
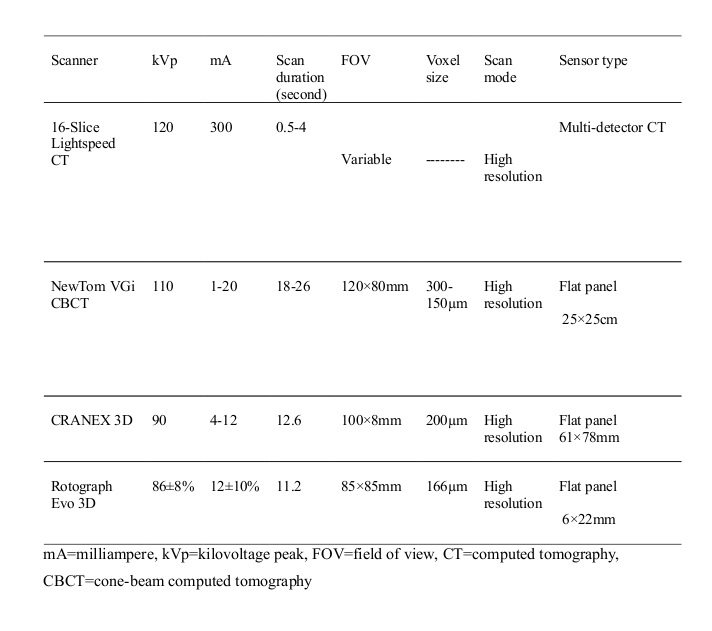
The specifications of the scanner units employed in the present study are summarized in Table 1.
To assess the correlation between HU and grayscale in the studied materials, the air was excluded from the study, and the seven remaining materials were compared.
Table 1: The specifications of the scanner units employed in the present study
Results
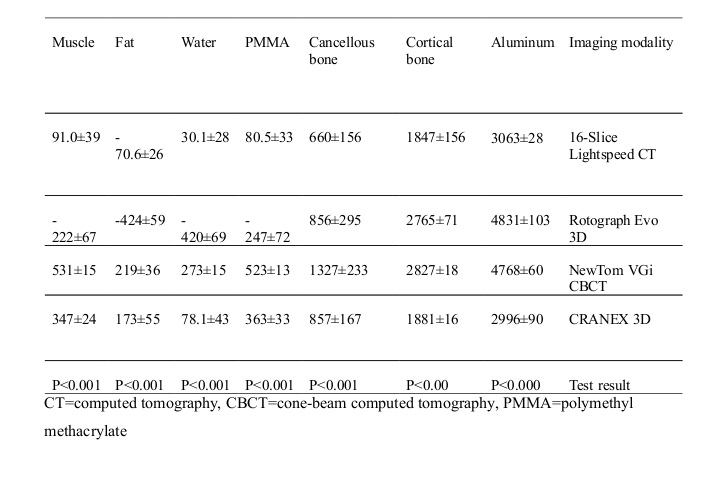
The present study involved four scanner units, including one CT scan unit and three CBCT units (CBCT1, CBCT2, and CBCT3). Seven tissue samples were assessed. Therefore, the total number of 28 samples were evaluated. Tissue densities are presented in Table 2.
Table 2: Densities of the assessed tissues according to the imaging modality
1. Aluminum
The lowest density for aluminum was reported by CBCT2 (2996) followed by CT (3063) while the highest density was reported by CBCT3 (4831). Analysis of variance (ANOVA) showed that the differences among the four units were significant (P<0.001). Duncan's post hoc test showed no difference between CT and CBCT2 or between CBCT1 and CBCT3 (P<0.21) while CT and CBCT2 were significantly different from CBCT1 and CBCT3 (P<0.01).
2. Cortical bone
The lowest density for this tissue was reported by CBCT2 (1881), and the highest density was reported by CBCT1 (2827; P<0.0001). Supplementary comparisons showed that CT was significantly different from the CBCT units (P<0.0001). CBCT1 and CBCT3 were not significantly different (P<0.2) while there were some differences among the three CBCT units (P<0.001).
3. Cancellous bone
The lowest density was reported by CT (660) while the densities reported by CBCT2 and CBCT3 were almost equal (856). The highest density was reported by CBCT1 (1327) (P<0.001). Multiple comparisons showed that CT, CBCT2, and CBCT3 were not significantly different (P<0.6).
4. PMMA
The lowest density was reported by CBCT3 (-247), and the highest density was reported by CBCT1 (523). Multiple comparisons showed a significant difference between the imaging units (P<0.001).
5. Water
Water density was -420 in CBCT3, 30 in CT, and 78 in CBCT1. The highest value was obtained by CBCT2 (273); the differences were statistically significant (P<0.01). There was a significant difference between CT and each of the CBCT units (P<0.001).
6. Fat
Fat density was -424 in CBCT3, -70 in CT, and 273 in CBCT2. The highest value was reported by CBCT1 (219); the difference was statistically significant (P<0.01). In other words, CT and CBCT3 rendered negative values while the values rendered by CBCT1 and 2 were not significantly different (P<0.4).
7. Muscle
CBCT3 showed the value of -222, CT reported the value of 91, and CBCT1 showed the value of 347 while the highest density was reported by CBCT2 (531). The differences were statistically significant (P<0.0001). Pair comparisons by the post hoc test showed that these units were significantly different (P<0.0001).
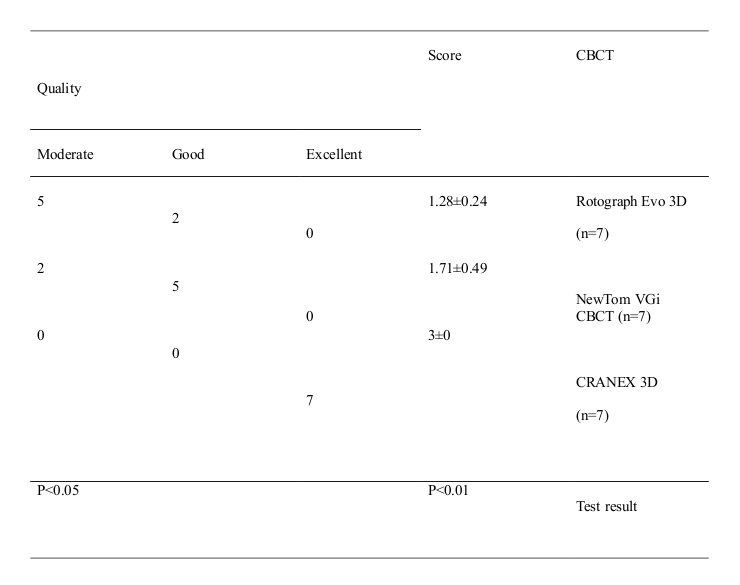
Table 3 shows that the highest score (the closest value to CT) was related to CBCT2 (score 3) followed by CBCT1 (score 1.7) while the lowest score belonged to CBCT3 (1.28). Kruskal-Wallis test showed that these differences in the scores are statistically significant (P<0.01), and Mann-U-Whitney test, through pair comparisons of the CBCT units, showed a significant difference between CBCT2 with CBCT1 and 3 (P<0.05), but there was no difference between CBCT1 and CBCT3 (P<0.2).
Table 3-Score and quality ranking of each cone-beam computed tomography (CBCT) unit in comparison with computed tomography (CT)
Discussion
Assessment of bone quality and quantity is a fundamental step before implant placement surgeries. This assessment should be of adequate accuracy and validity. Although CBCT has been widely implemented in different dentistry fields, a reliable method for the assessment of bone quality by CBCT has not yet been recognized. (20) Nowadays, CT is the gold standard for bone density estimations. (4,6,7) Therefore, many studies have assessed the correlation between tissue densities in CT and CBCT, and different results have been achieved. (17,18,20-35)
The present study showed that tissue densities are different in CT and CBCT units. CRANEX 3D showed the closest values to CT followed by NewTom VGi and Rotograph Evo 3D CBCT units.
A phantom comprised of seven materials with different densities was used in the present study. Mah et al used a standard phantom constructed under laboratory conditions in which each tissue was completely homogeneous. (7) They declared an extremely strong correlation between CT HU and CBCT grayscale and rendered an equation for calculating HU based on CBCT grayscale. (7) Lagravere et al (14) identified the differences with the clinical conditions to be among the limitations of the study by Mah et al. (7) Therefore, in the present study, natural tissues of a sheep’s head were used.
Parsa et al declared a strong correlation between CBCT grayscale and CT HU; however, they emphasized that these two are not equal; they attributed the differences to the increased noise, scatter, and artifact in CBCT. (4)
Emadi et al stated that CBCT grayscale and CT HU are dissimilar and showed that the densities obtained by two different CBCT units are also dissimilar. (21) However, the results of the present study showed a strong correlation between aluminum and cortical bone densities obtained by NewTom VGi and Rotograph Evo 3D CBCT units.
The thickness of the tissues is an important factor that can influence tissue density estimations. Therefore, in the present study, all the samples were of equal thickness. Although Katsumata et al stated that in thicker tissues, density estimation by CBCT is more accurate, they concluded that exposure parameters can have a greater effect on density assessment. (6) They attributed the differences in tissue densities obtained by different units to the differences in the exposure parameters. (6) Parsa et al also stated that changes in the exposure parameters could affect tissue density. (32) In the present study, we tried to use comparable milliampere (mA) and kilovoltage peak (kVp) as permitted by the devices although some differences were inevitable. Haristoy et al hypothesized that the tissue density of an object is more influential in CT and CBCT compared to the projection intensity. (30)
In the present study, the phantom was placed at the center of the FOV. Lagravere et al found no significant differences between CT HU and CBCT grayscale in different areas of the FOV (31) while Oliveira et al found different results and stated that tissue density is influenced by the location of the tissue in the dental arch. (33)
The three CBCT units in this study operated in the high-resolution mode. Consequently, the signal-to-noise ratio (SNR) was increased, rendering high-quality images with a high spatial resolution, which can significantly affect tissue density measurements. (32) De Vos et al showed that CBCT units lack similar adjustments and uniformity; these differences in manufacturing can affect the results of tissue density estimations with non-uniformity among different units. (35) Therefore, we tried to select similar FOVs as possible but some differences were inevitable. Parsa et al showed that the size of the FOV could influence CBCT grayscale. (32)
We used a single software (the OnDemand 3D) for the observation and assessment of the scans of the three CBCT units to prevent the errors that could happen upon using multiple software. Mah et al implemented 11 CBCT units and a single software, similar to ours, to match the ROI in the samples. (7)
The results of the present study indicate that the densities obtained by the CBCT units show higher numbers than CT HU in similar tissues. The NewTom VGi CBCT unit showed higher densities for all the samples in comparison with the CT unit. Also, all the samples were shown to have higher densities in the CRANEX 3D CBCT unit compared to CT although the densities of aluminum and cortical bone showed close numbers to CT HU. In the Rotograph Evo 3D unit, the numbers were higher in comparison with CT HU, except for water, fat, and PMMA, which showed negative values. Scarfe et al found similar results. (29) Although Lagravere et al found a linear correlation between HU and CBCT grayscale, they also found higher CBCT grayscale numbers compared to HU. (14) Generally, kVp and mA in CBCT are lower than that in CT, and consequently, CBCT has a higher SNR, which causes higher tissue density numbers compared to CT HU. (32)
Haristoy and colleagues assessed the effect of different exposure parameters on grayscale and found a strong correlation between HU and CBCT grayscale. (30) Due to the different results obtained from different CBCT units, they recommended the use of a calibrated phantom before imaging to ensure the accuracy of density estimations. (30)
It seems that although some studies have found a strong correlation between HU and CBCT grayscale, (4,7) there is controversy among the results due to the differences in the study methods, statistical analyses, and scanner units. As stated recently by Pauwels et al, although many efforts have been made to determine accurate CBCT grayscale numbers, it is rational to consider these data unreliable. (36) The limitations of CBCT units compared to medical CT units, which can be related to the characteristics of CBCT units, such as SNR, scatter radiation, and different artifacts, are most probably the main reason for this disagreement.
Conclusion
Considering the results, CBCT cannot accurately calculate tissue density. It is recommended to assess the effect of factors such as tissue thickness, FOV size, location of the tissue in the FOV, and exposure parameters on tissue density calculations.
| Rights and permissions | |
 |
This work is licensed under a Creative Commons Attribution-NonCommercial 4.0 International License. |